Published February 3rd 2026
Are UK Taxes Really That High?
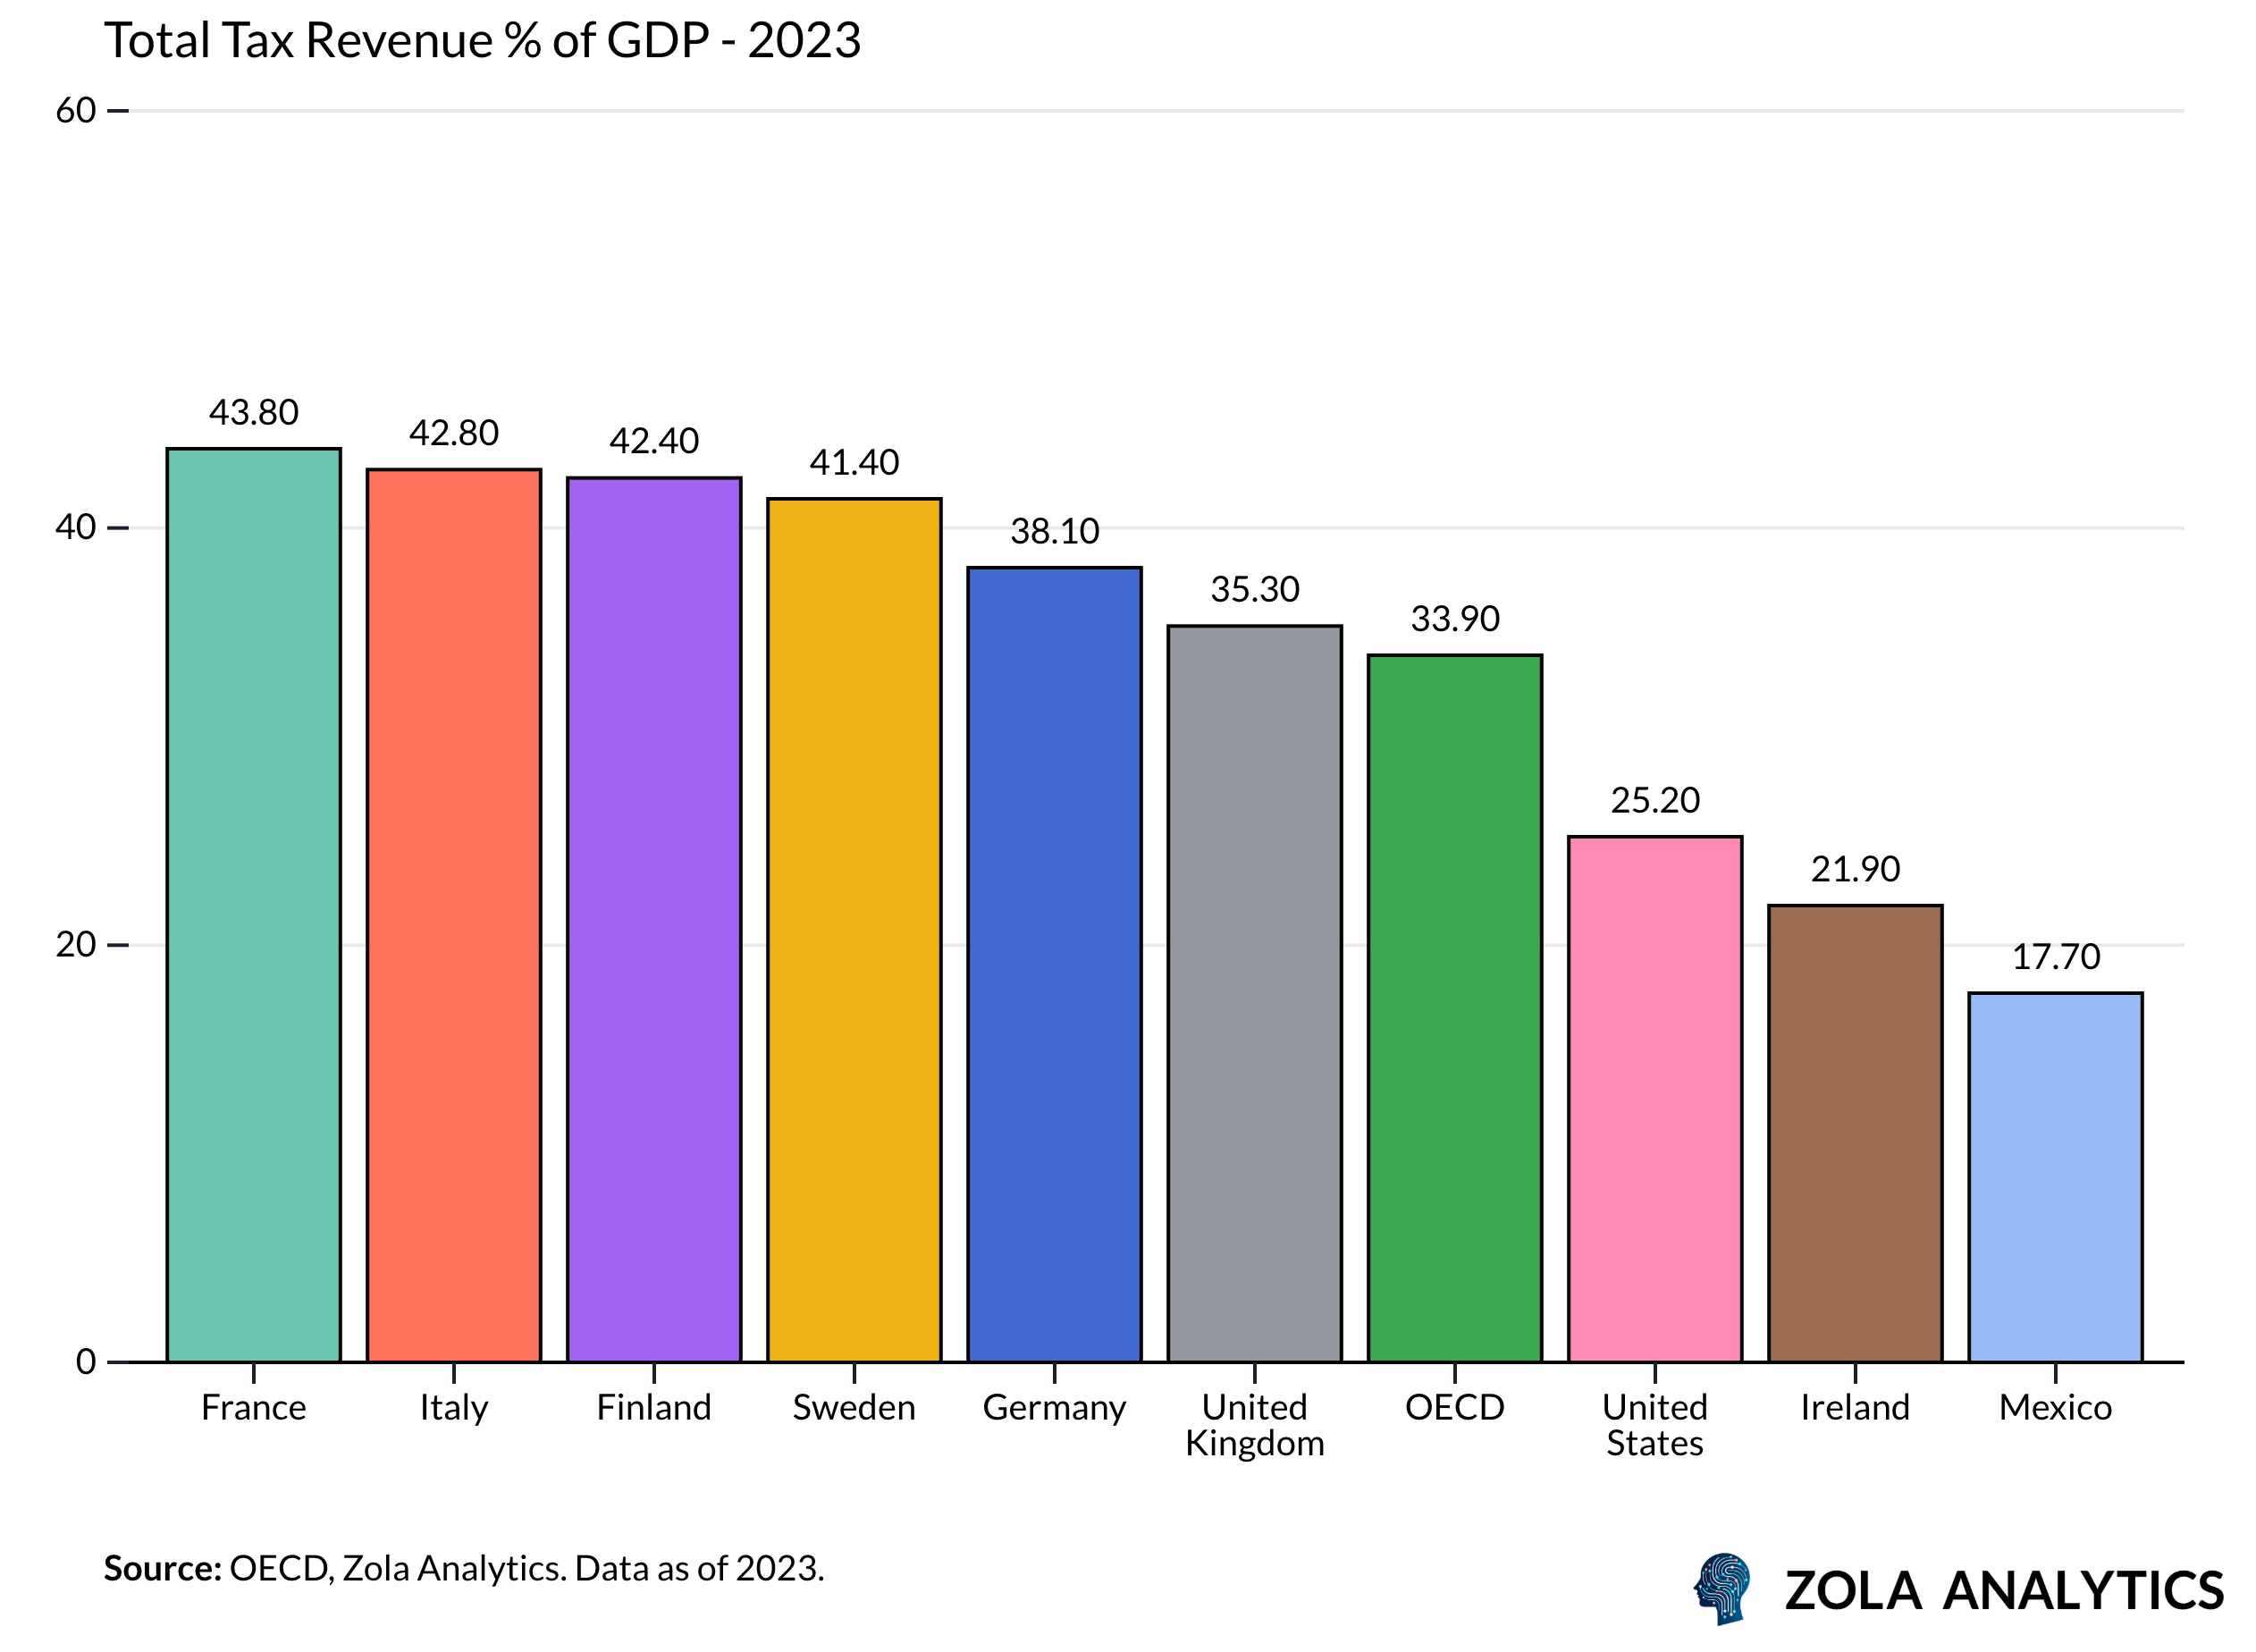
At 35.3% of GDP, the UK’s tax burden may seem high — but in global context, it sits closer to the middle of the pack. According to the OECD, countries like France have tax-to-GDP ratios nearing 44%, while the United States collects just 25.2%. Scandinavian and other Western European countries routinely exceed 40%, placing the UK firmly between low-tax economies like the US and high-tax welfare states like Sweden and France.
A Steady Climb
Looking ahead, the Office for Budget Responsibility forecasts that the UK’s tax burden will rise to 37.7% by 2027–28 — a significant increase of more than two percentage points. Yet even at that level, the UK would remain below many of its European counterparts.
The Quiet Effect of Fiscal Drag
A major contributor to this rise is fiscal drag. Since 2021–22, both the personal allowance (GBP 12,570) and the higher-rate income tax threshold (GBP 50,270) have been frozen, despite inflation. As wages rise in nominal terms, more income becomes subject to tax, pushing many earners into higher brackets even if their real incomes remain unchanged. This quiet mechanism effectively raises taxes without changing the official rates. The OBR estimates that fiscal drag alone will generate an additional GBP 25–30 billion annually by 2027–28.
A Different Tax Structure
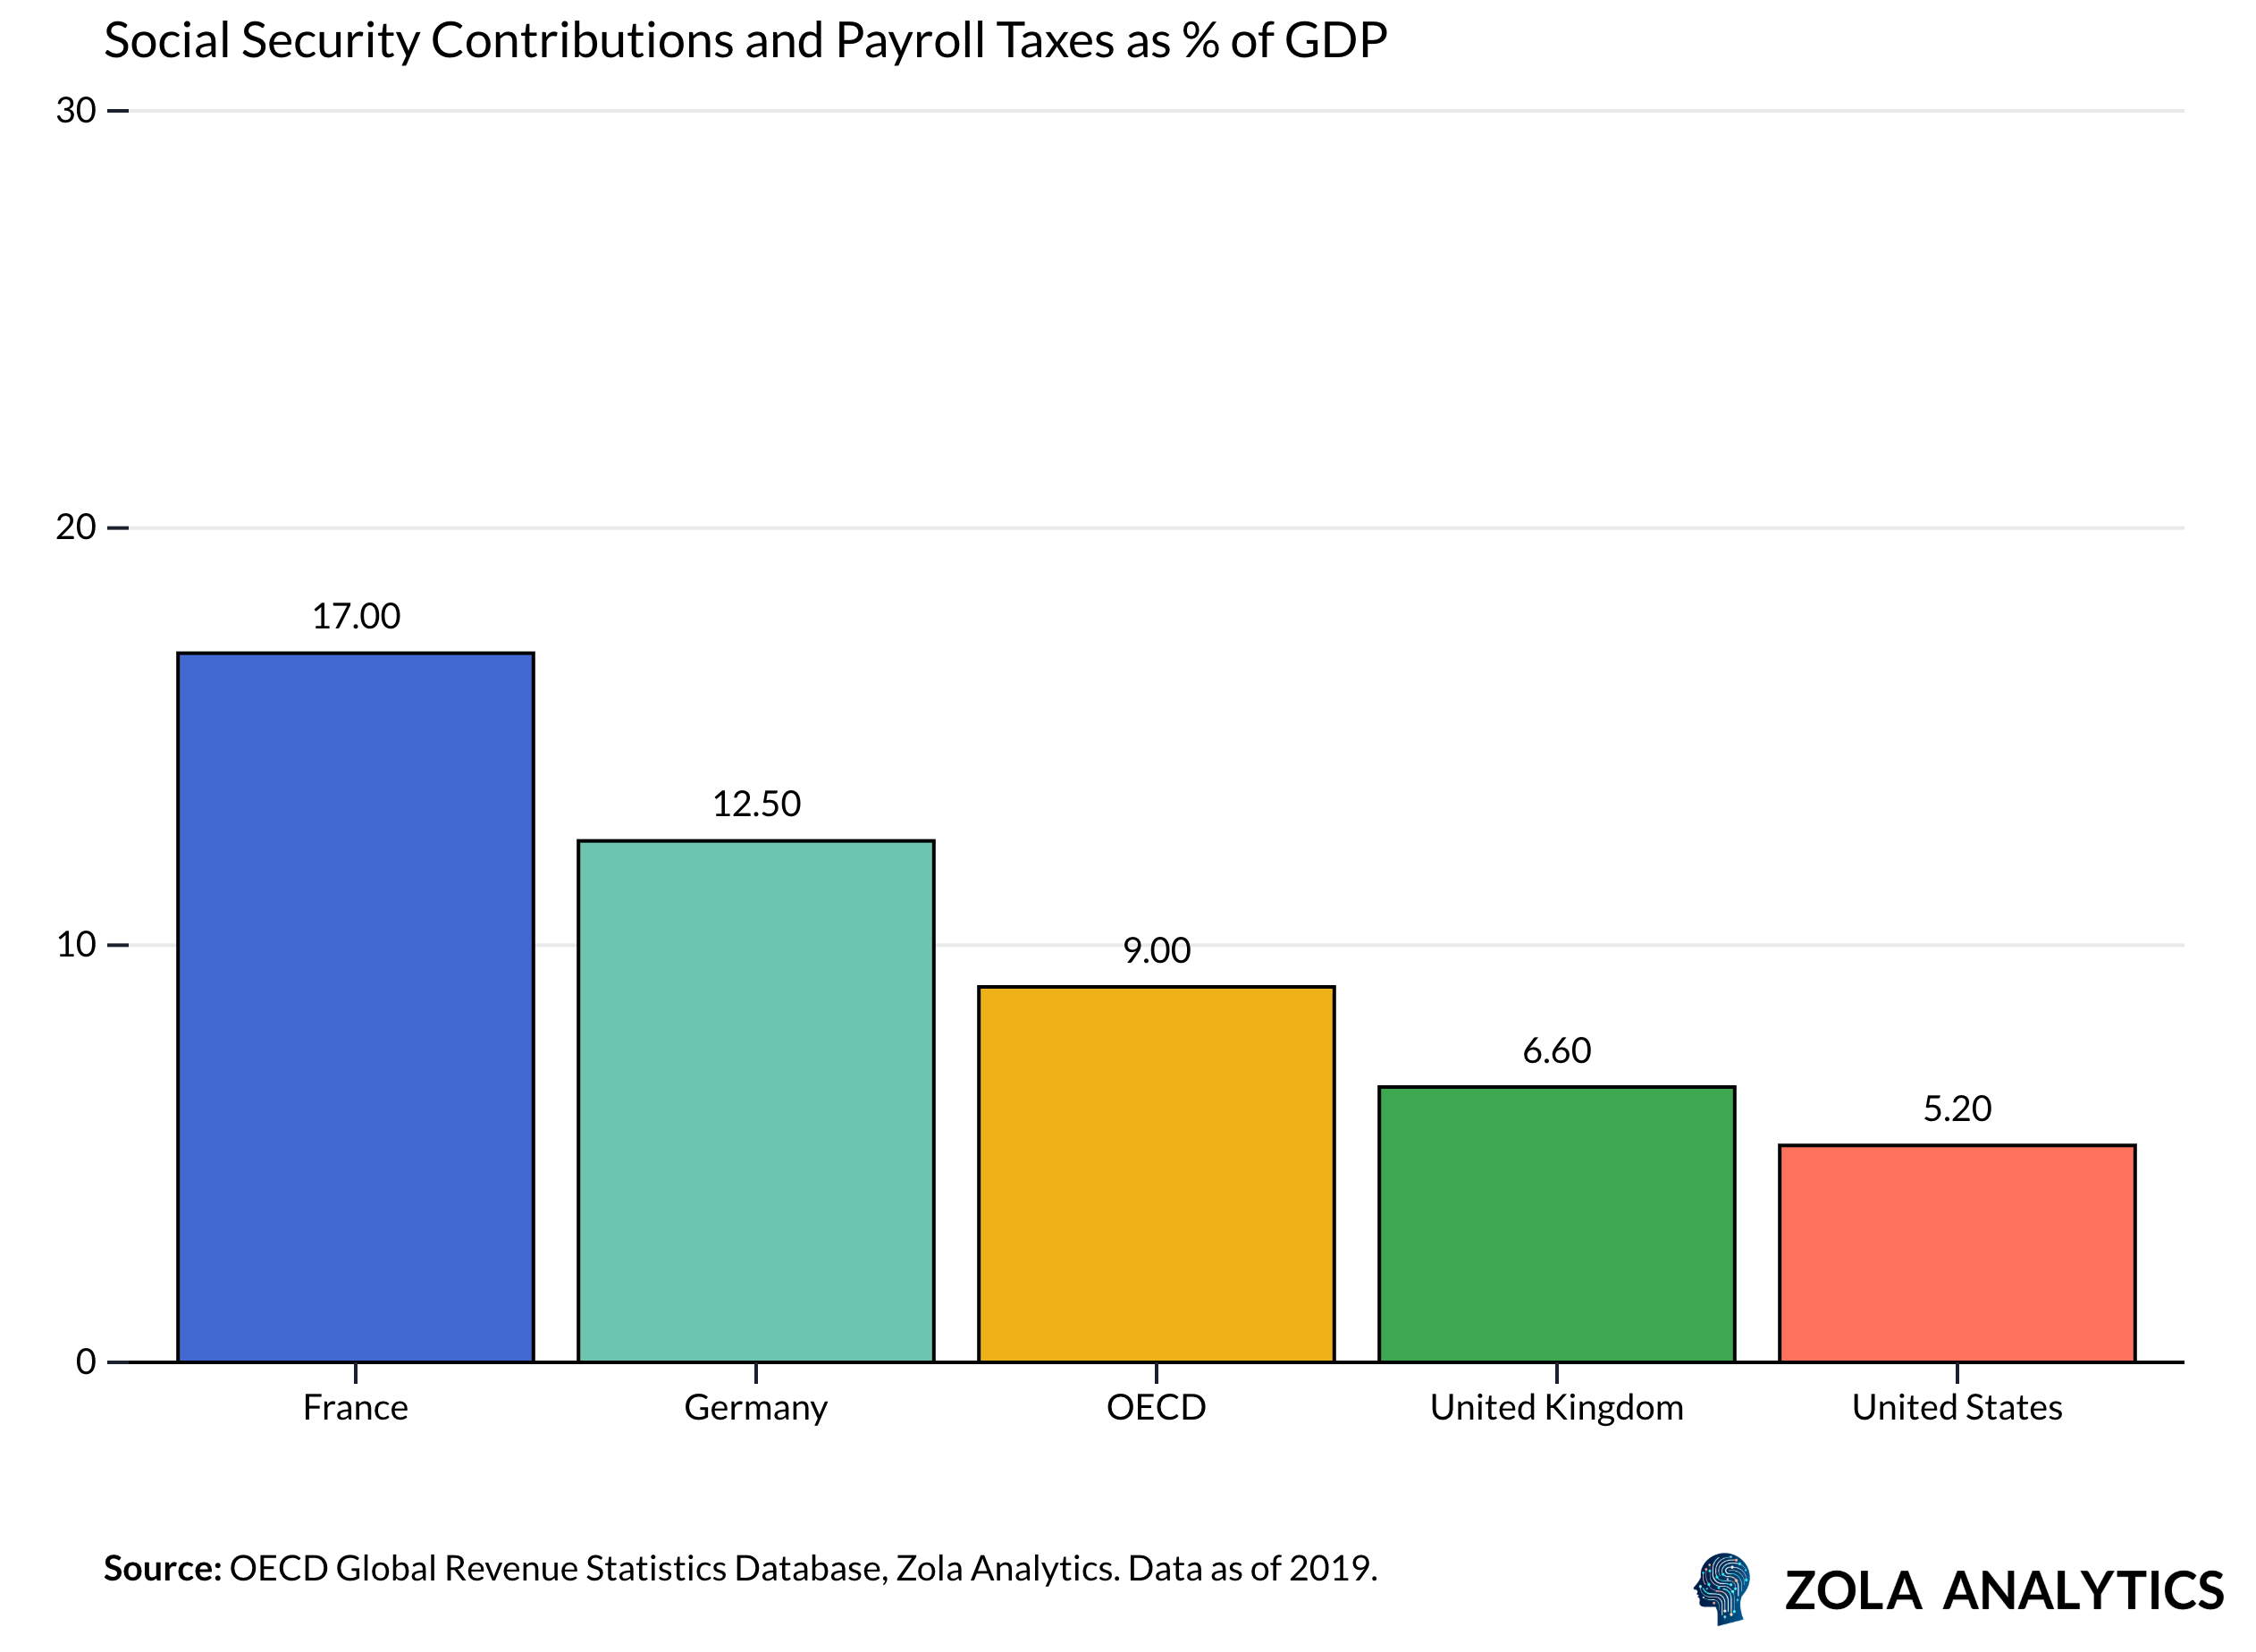
Another key structural factor is the relatively low level of social security contributions in the UK. In 2019, the UK collected only 6.6% of GDP from such contributions, compared to an average of 12% across the EU14. This difference helps explain the UK’s lower overall tax burden, particularly for median earners. While the UK tax system is relatively progressive — with high earners facing average rates closer to their European peers — middle-income workers tend to pay less, largely because of lower employer contributions.
The Fastest Riser
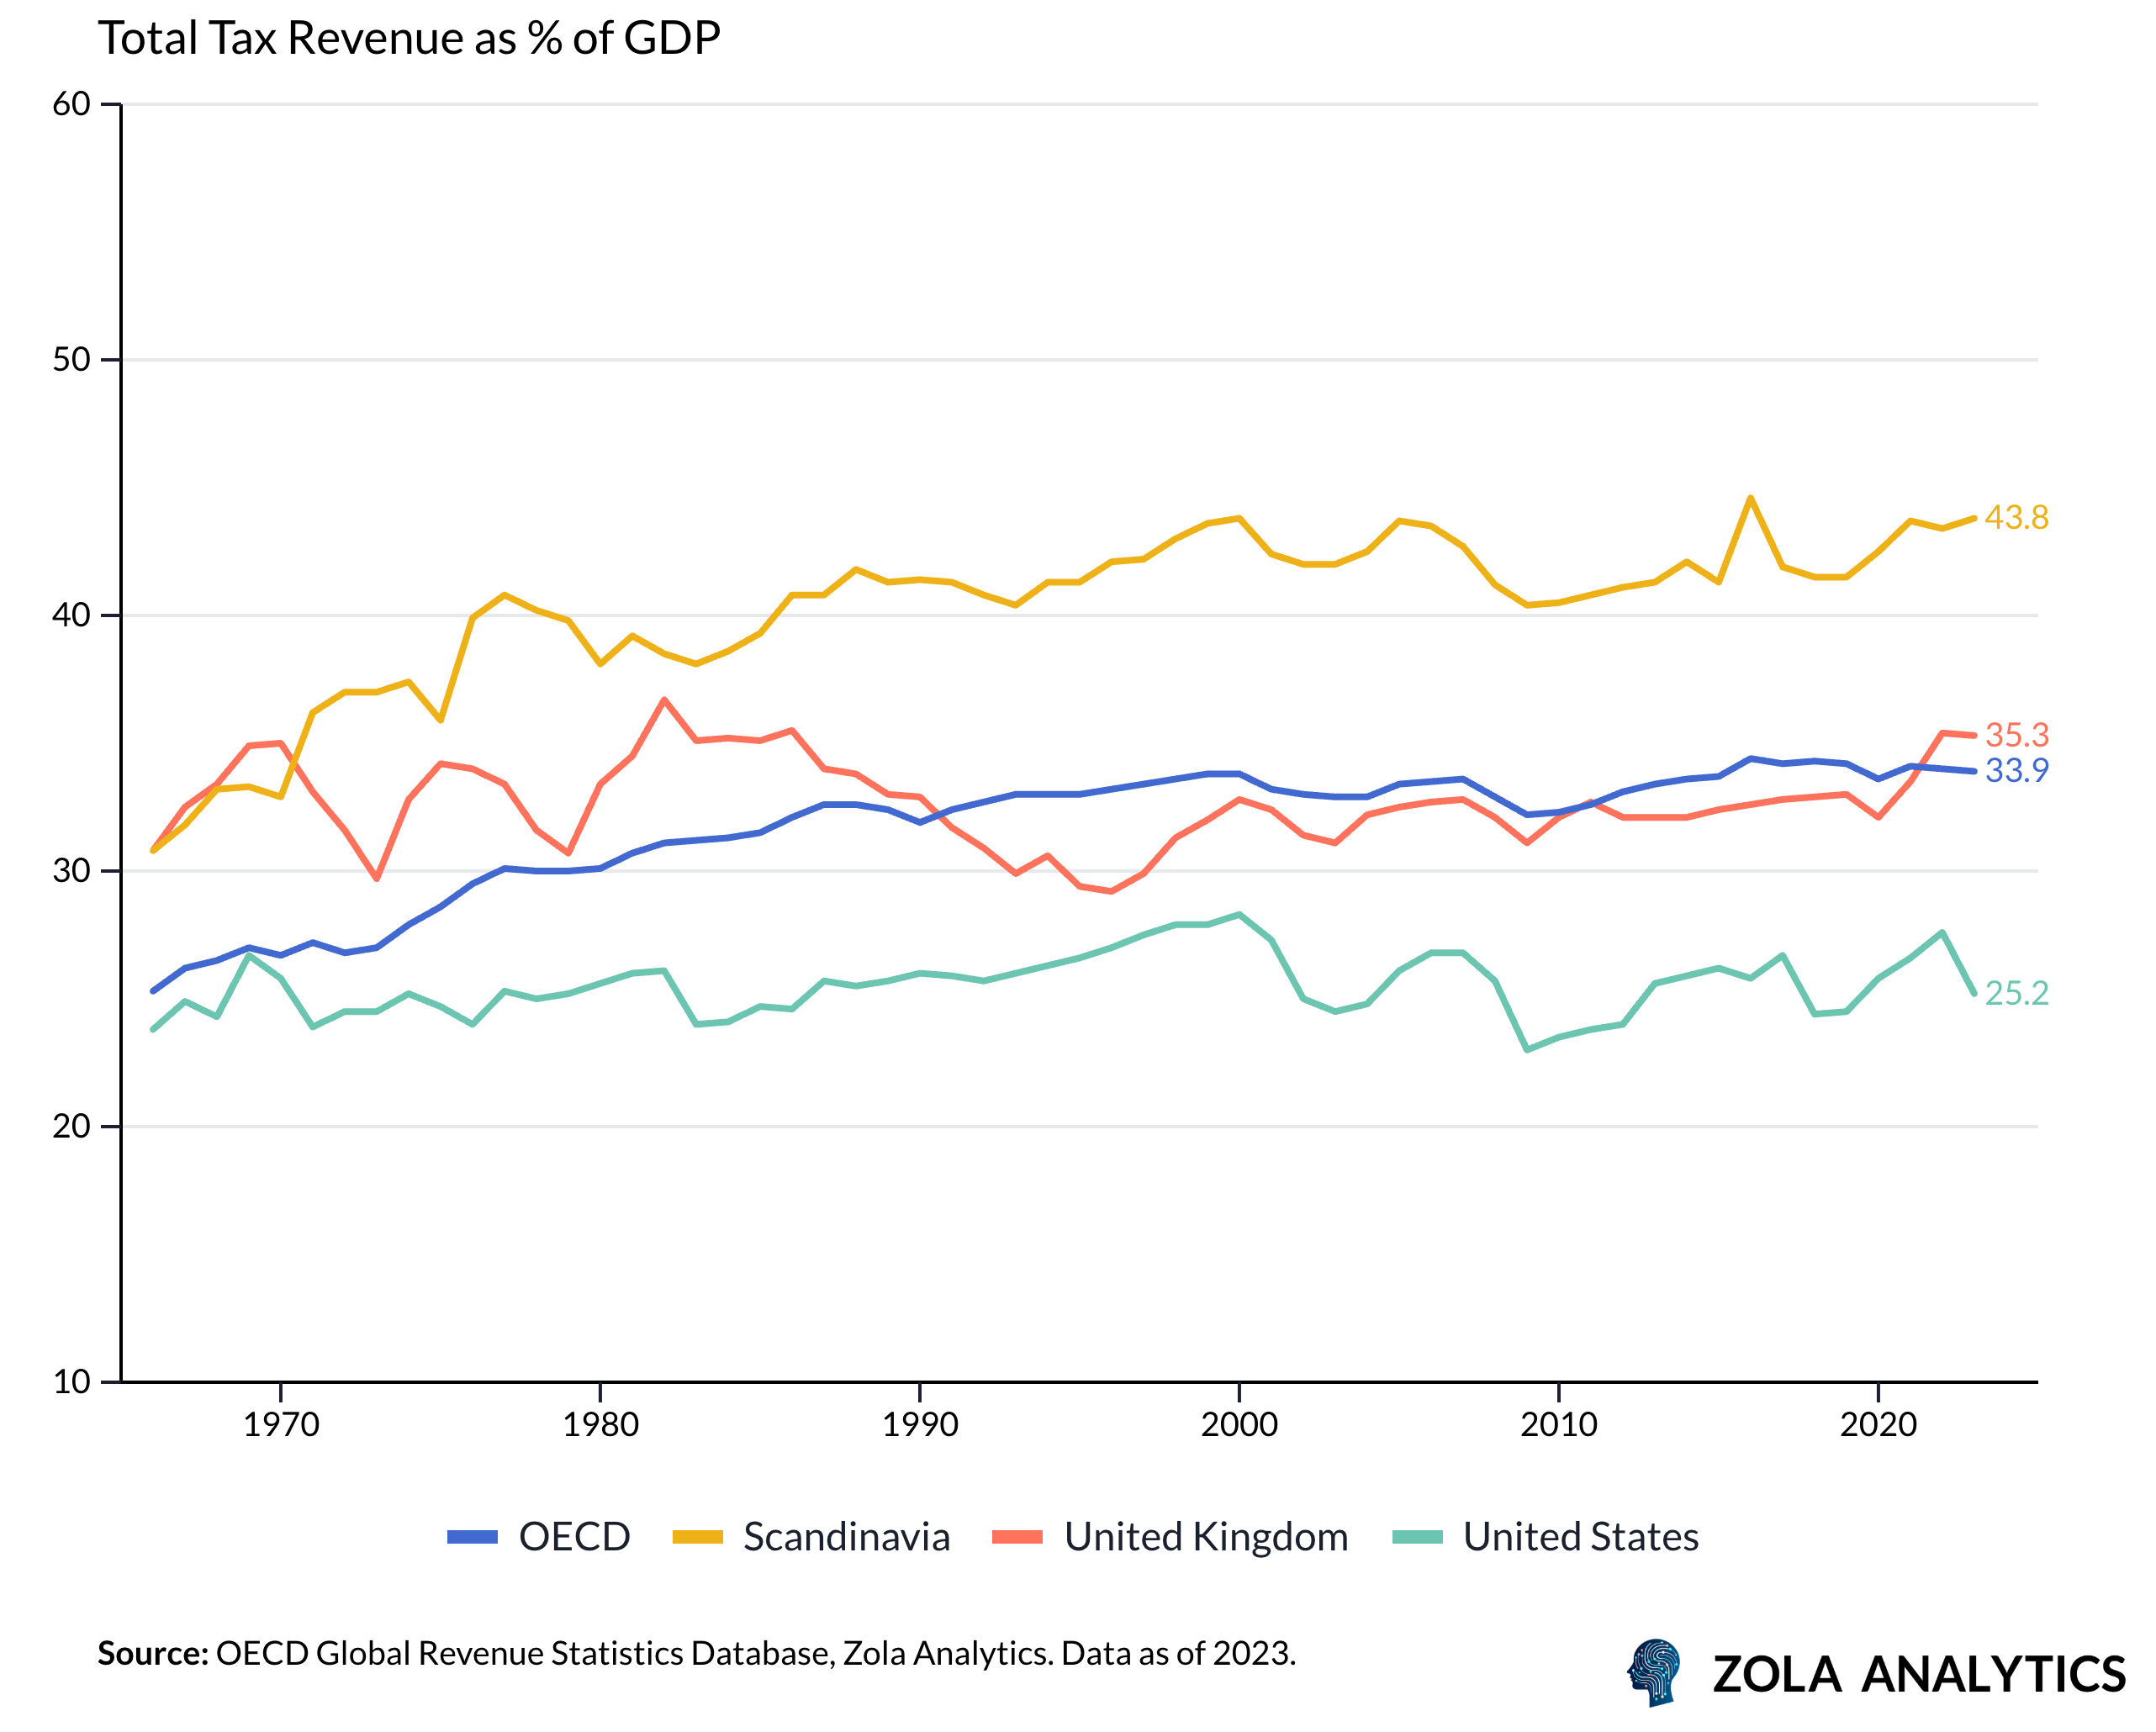
Historically, the UK’s tax-to-GDP ratio hovered around 32–33% through much of the 1990s and 2000s. Today’s level of 35.3% is among the highest in modern times, though not a post-war record. What stands out is not just the level but the pace of change. Since 2014, the OECD average has risen by just 0.8 percentage points. In contrast, the UK’s has jumped by 3.6 points — a sharp acceleration that helps explain why many Britons increasingly feel overtaxed, even if international comparisons suggest otherwise.
A Question of Trade-Offs
In a broader sense, the UK represents a mid-point in global tax regimes. It doesn’t have the low rates or limited public services of the US, nor the expansive welfare systems seen in countries like France or Sweden. Each model reflects a different societal contract. Taxes are ultimately a trade-off for public services. Concerns about NHS waiting times or rising university fees could be addressed through higher public spending — but that would require a political and societal willingness to pay more. In the end, the core question isn’t just how much tax we pay, but what we get in return.