
Published February 22nd 2026
6-min read
How Did We End Up Here?
It’s always been hard to find an optimist in Britain. A skim through post-war magazine covers tells a story of national angst.
It’s been almost 50 years since the Economist declared that “Britain is bust” after Denis Healey went cap in hand to the IMF. But for all the challenges the UK faced in the 1970s, Rachel Reeves would dearly love to preside over an economy with 2.5% productivity growth. Since 2010 it has averaged 0.5%.
Meanwhile, pressures are mounting on the government - over Palestine, immigration, and civil liberties - and after an underwhelming first year in office, it remains to be seen whether their growth agenda will bear any fruit.
In today’s issue of Zola Global Macro Chartbook we take a broader look at the scale of the task on the government’s hands and ask: is the current doom and gloom justified?
Crisis? What Crisis?
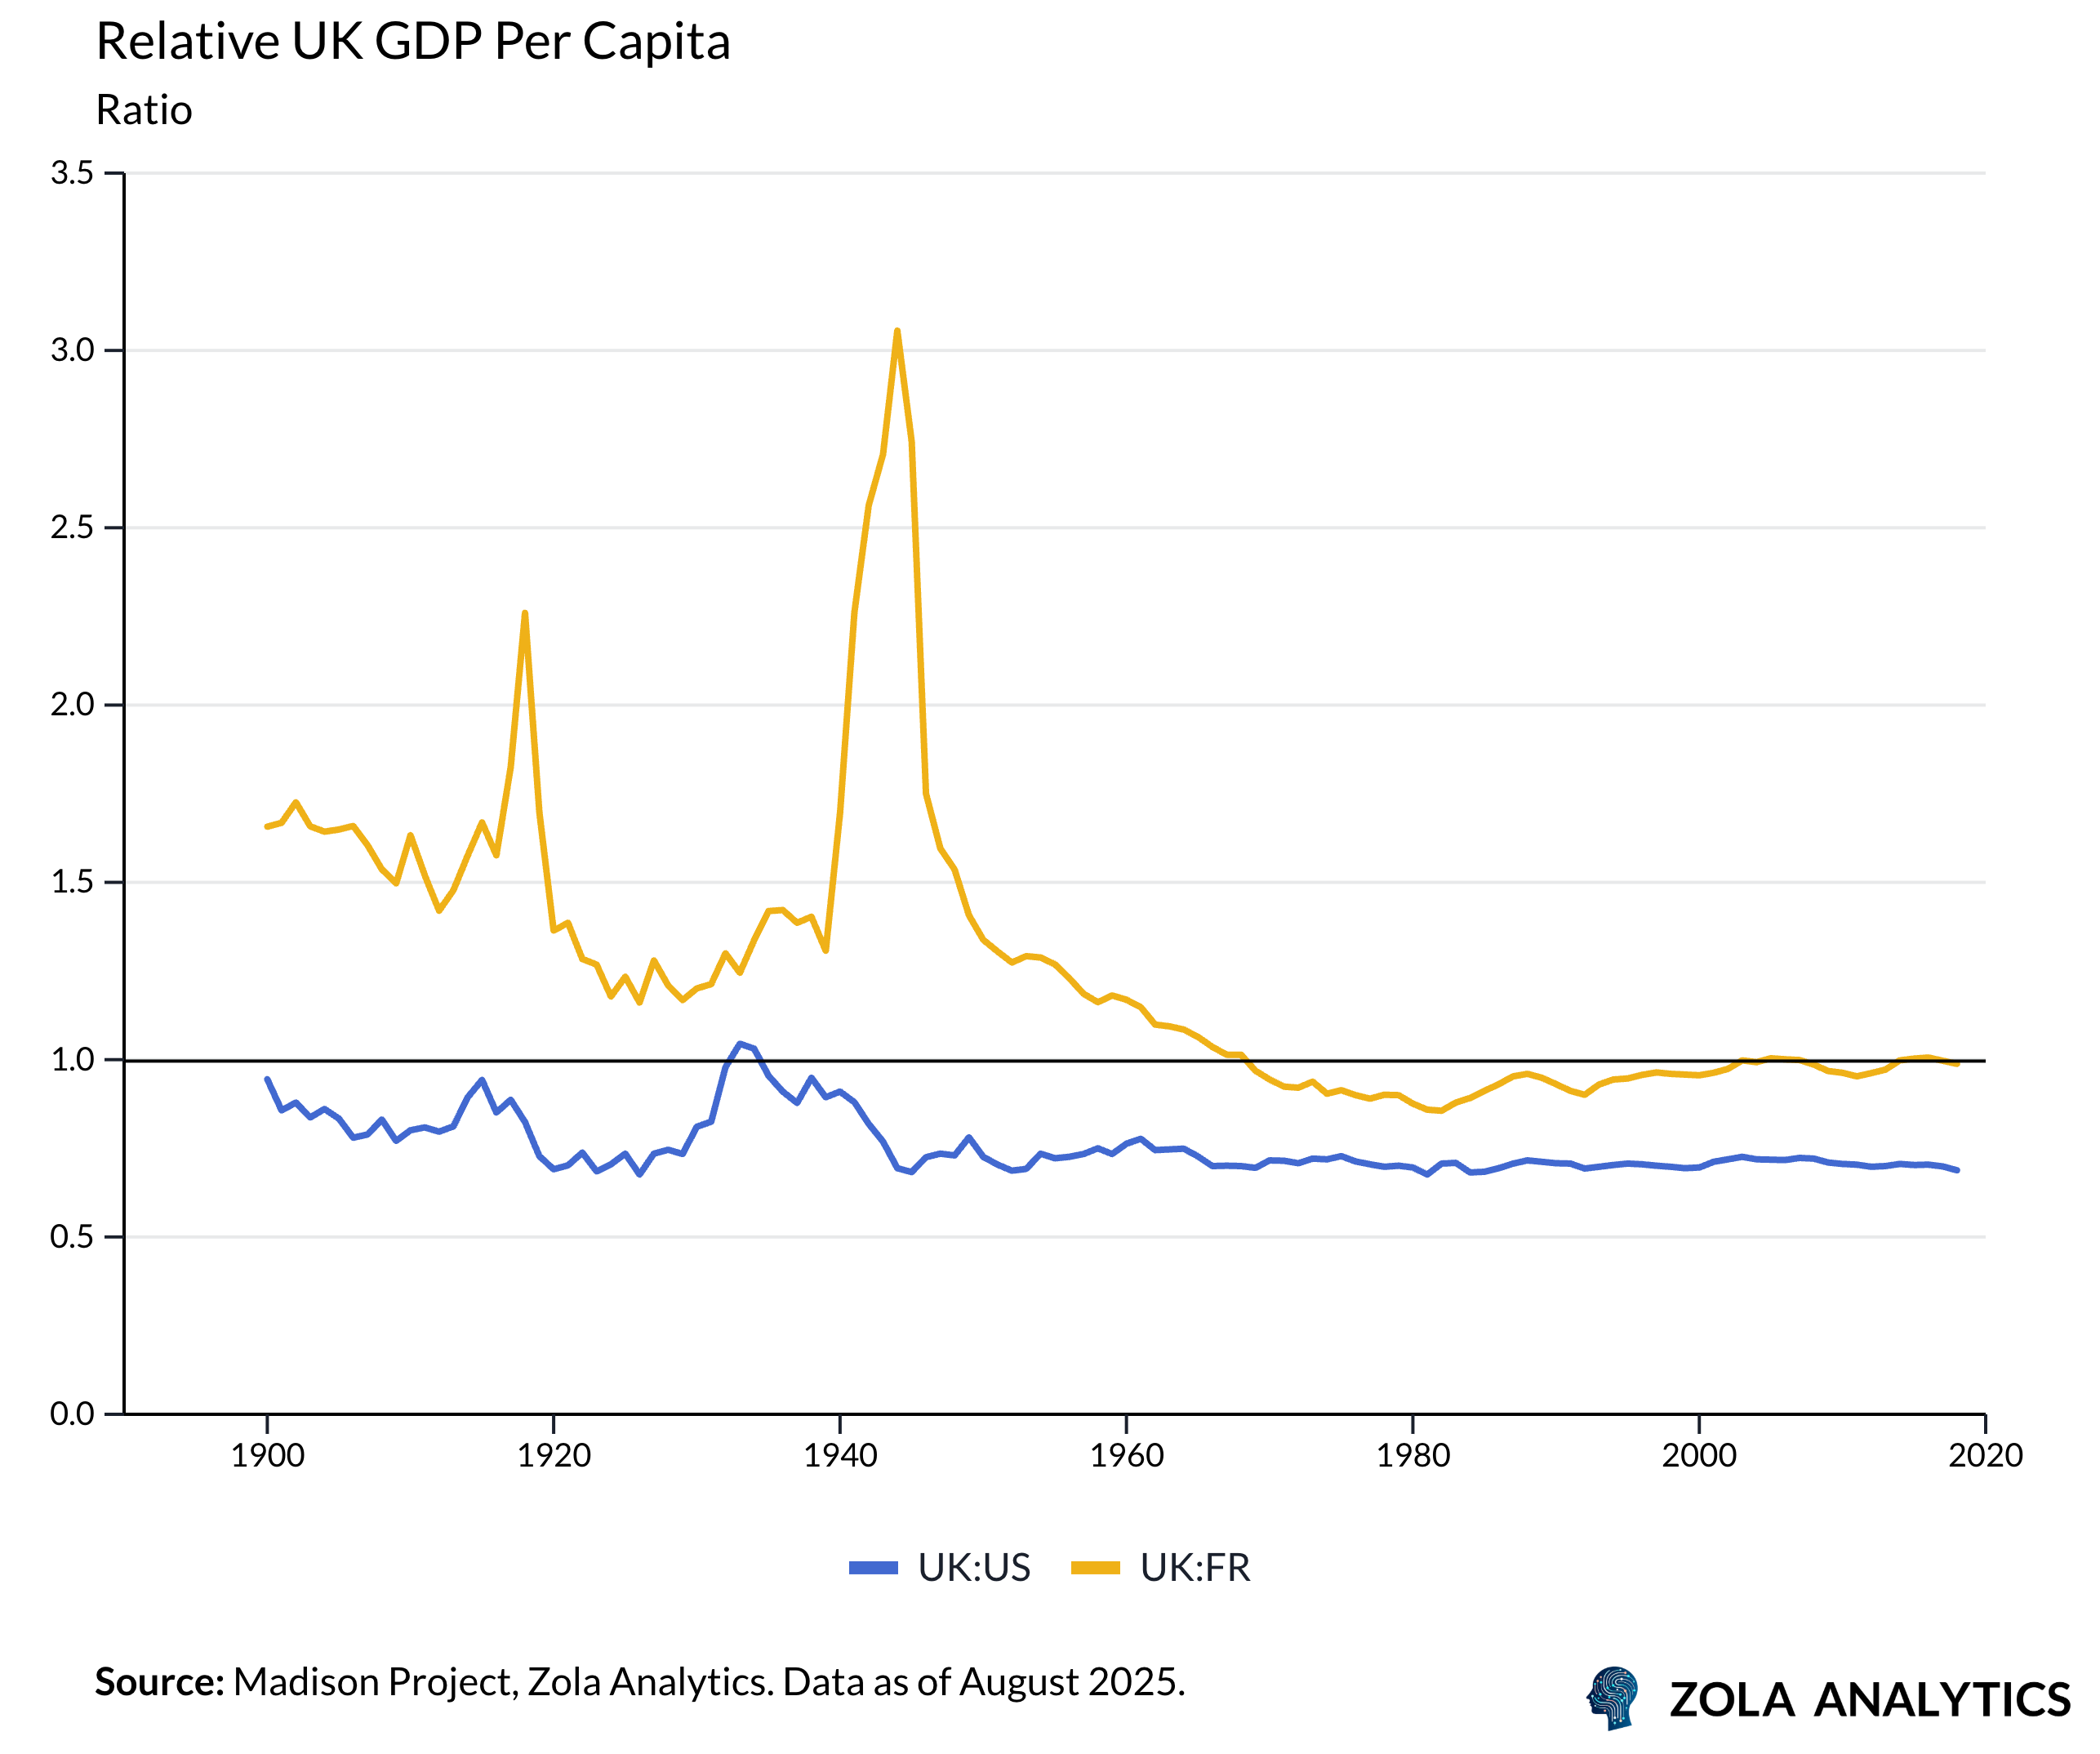
When we zoom out, the long-run story of UK decline looks overwrought. Notwithstanding the Great Depression and World War II, the UK has maintained a roughly constant level of GDP per capita relative to the United States since 1920. Compared to France, since falling slightly behind during Les Trente Glorieuses, the UK has actually outperformed.
All developed economies have suffered from slower growth since the 1970s. This is mostly explained by ageing populations, decelerating growth in human capital, the plateau of women’s labour-force entry, and a shift of spending and jobs into slow-productivity services as countries get richer.
Before we pour water on the pessimists though, we should investigate the data a little more closely. The cold arithmetic of growth economics says GDP per capita can rise in only three ways: higher labour productivity (more output per hour), greater labour utilisation (more hours worked per person), and higher employment (a larger number of people in work). In the UK’s case, the weak link is productivity.
When we look at productivity, there’s no denying that the UK has underperformed.
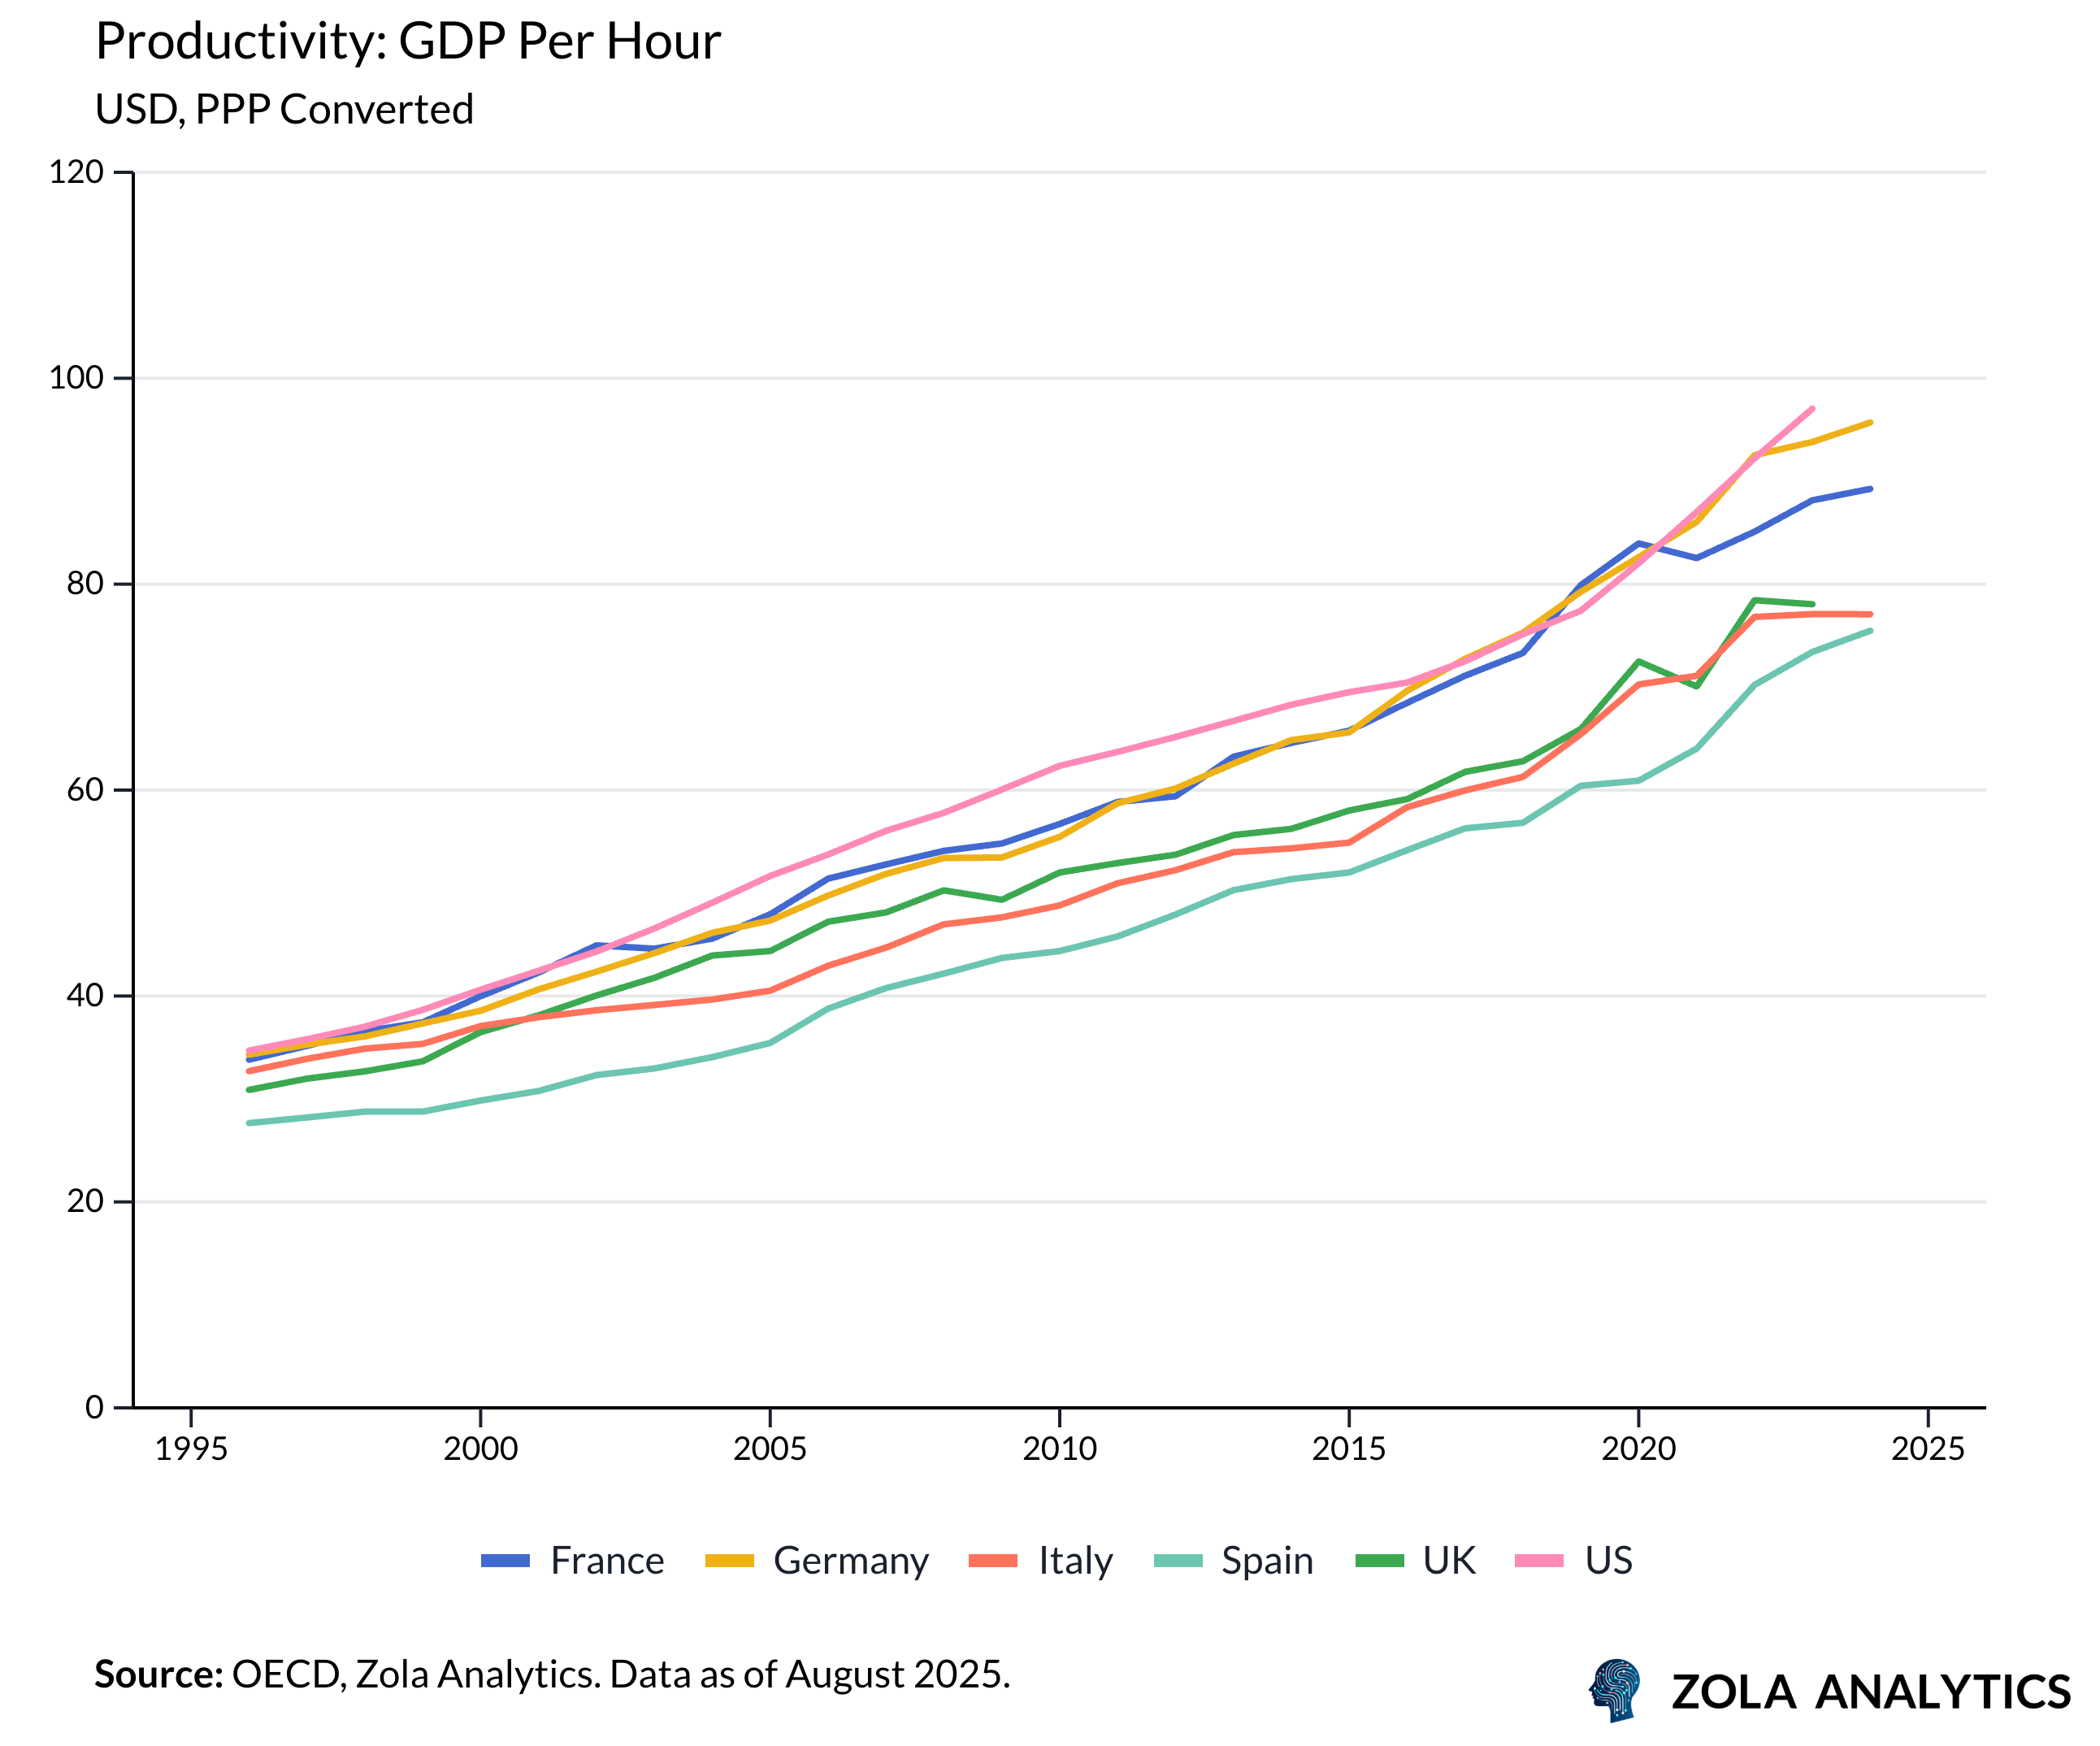
On output per hour we trail the US, France and Germany, and our post-2008 growth record sits closer to Italy (and not far from Spain) than to our northern European peers. And when we investigate sectoral trends, we find that things could have been even worse.
Papering Over the Cracks
For three decades, four big tailwinds flattered the UK’s numbers. But now, each one has become a drag.
Globalisation and The City
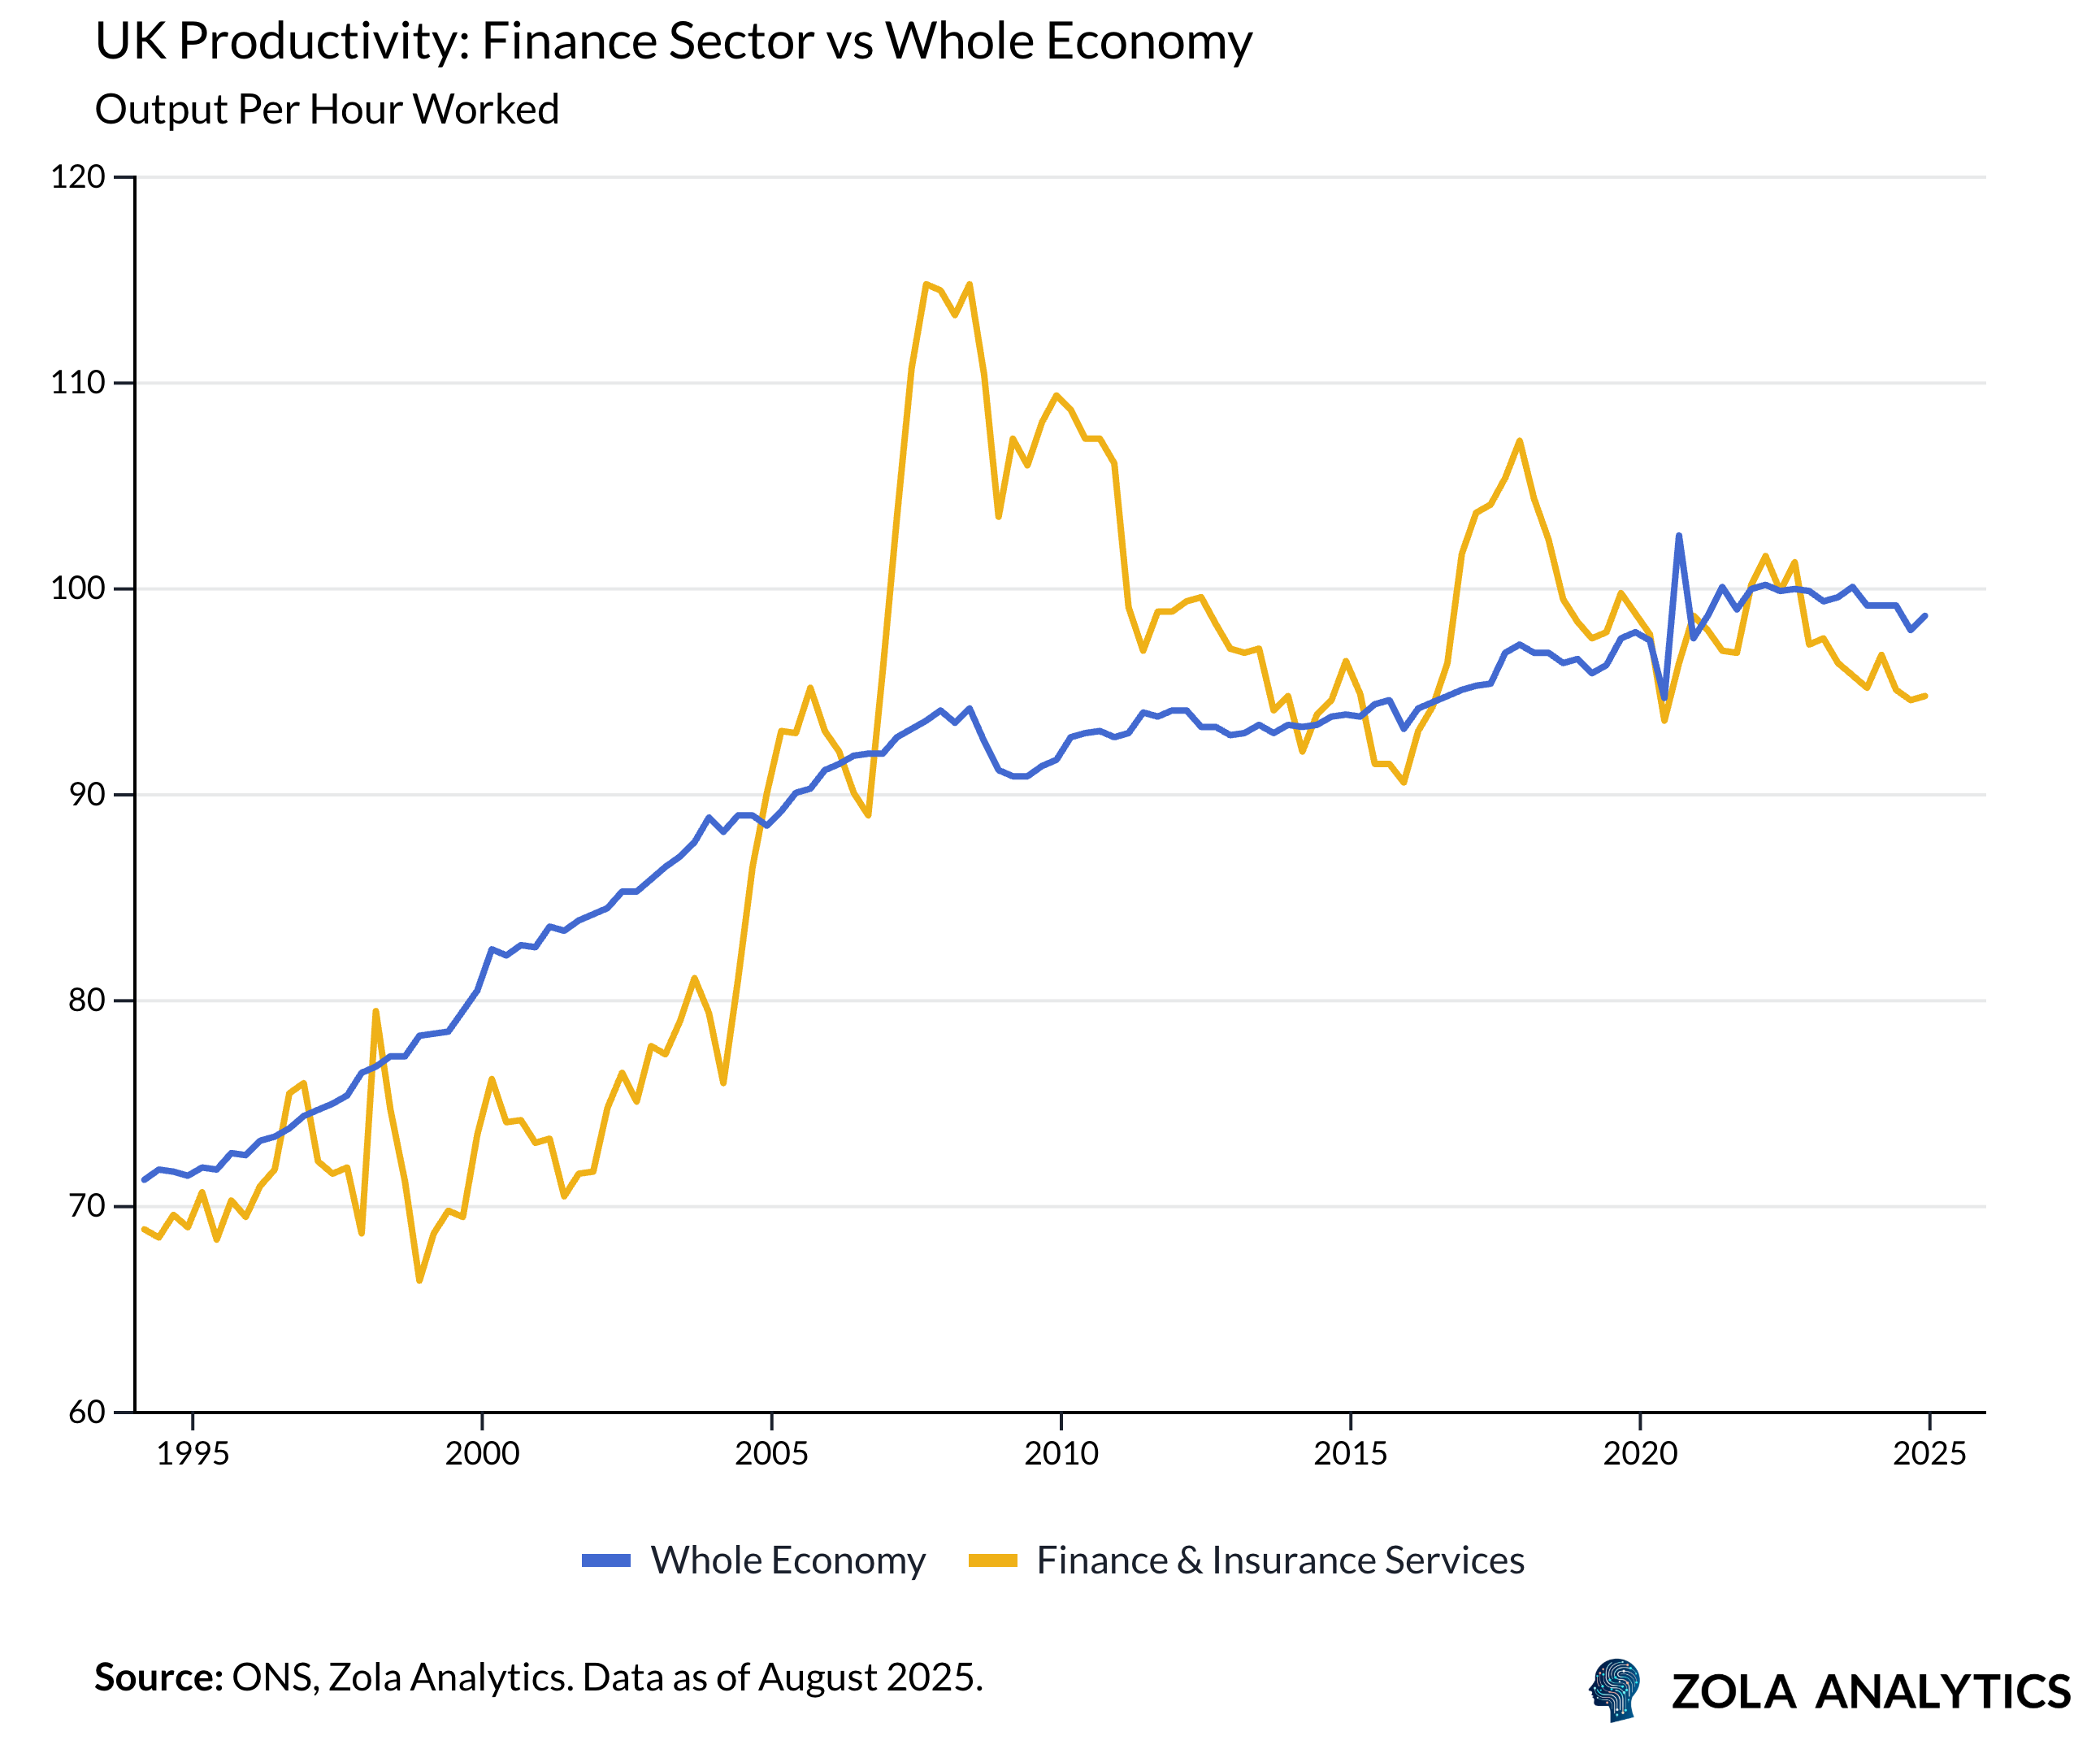
From the Big Bang through the 2000s, the City rode a once-in-a-generation expansion in cross-border trade and capital flows. London intermediated the world, pulling in profits, high wages, and tax receipts that masked weak investment elsewhere.
After the Great Financial Crisis, financial sector productivity flatlined. Returns were squeezed by higher capital and compliance costs, risk-taking declined, and the sector’s spillovers into the median firm proved meagre. The City remained a high-wage enclave, but it no longer propelled economy-wide productivity.
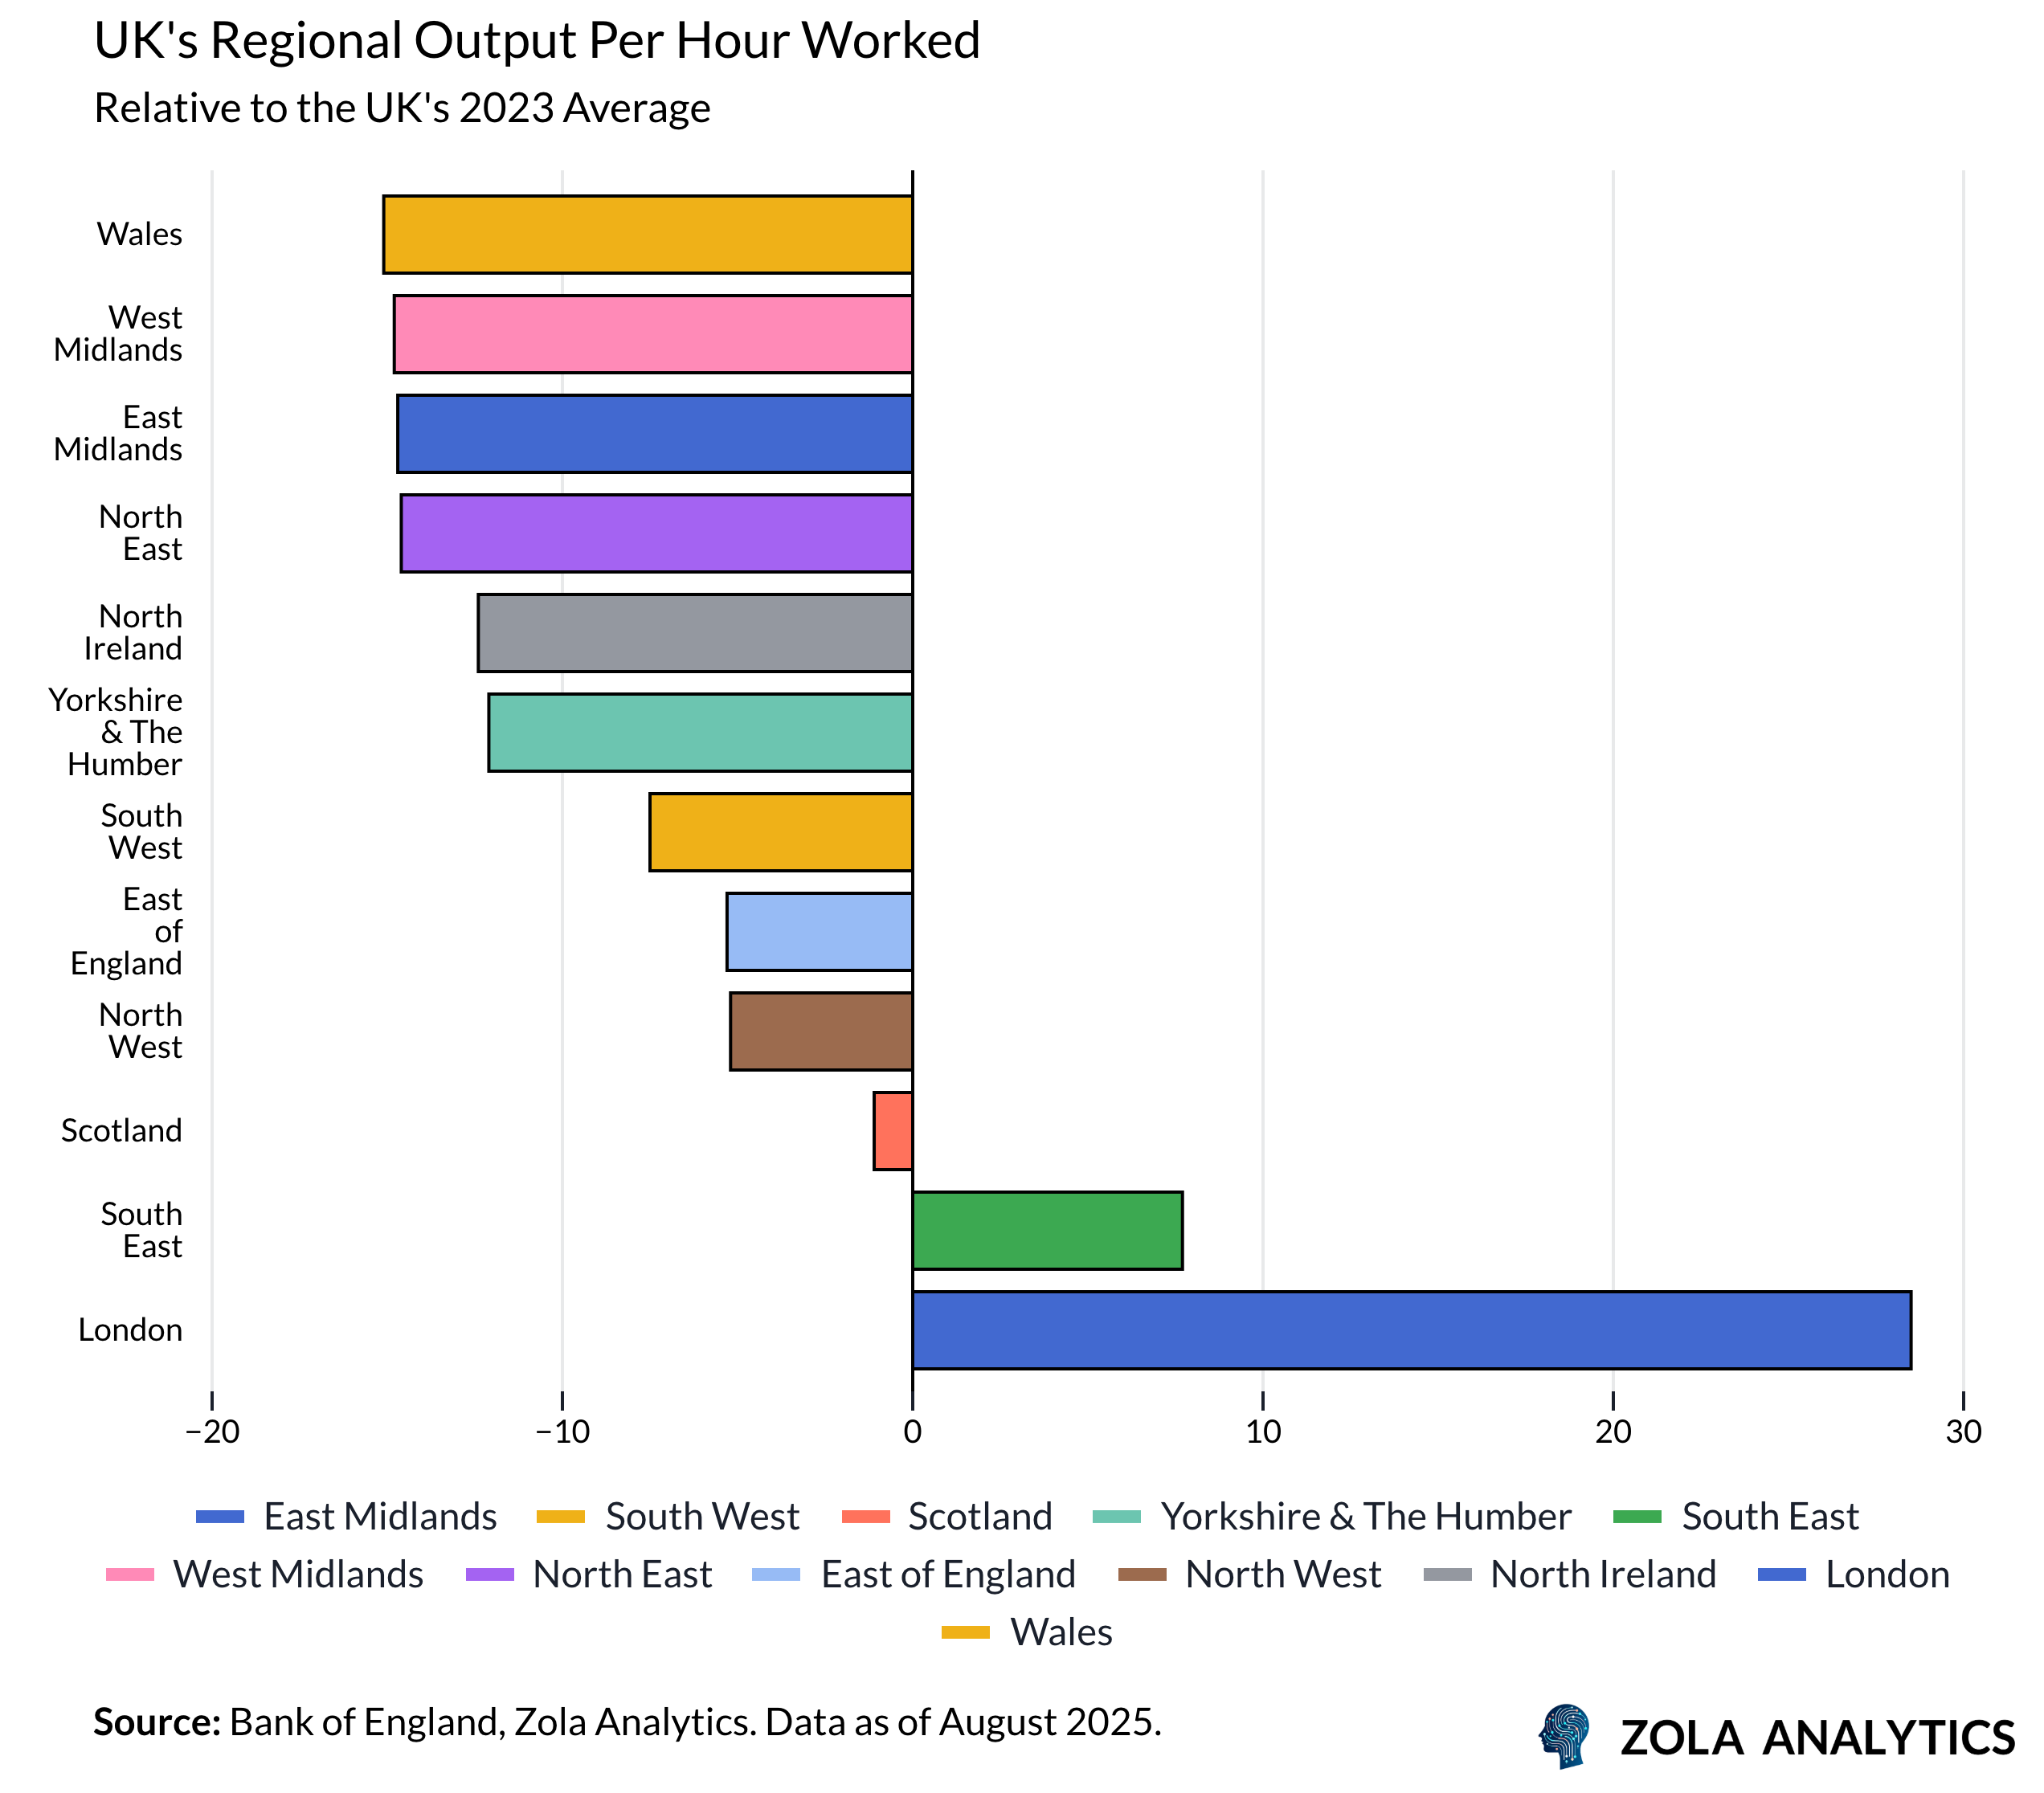
London’s dominance has distorted the UK economy. Talent, capital, and attention clustered in the city, pushing up housing and commercial costs and crowding out investment in the rest of the country. Indeed some regions in the UK are extremely poor by European standards. Only London and the South East have higher productivity than the national average.
North Sea Oil
A maturing basin delivered a windfall: lower import bills, stronger sterling, and billions in fiscal revenues. It bought time - energy was cheaper, the current account looked healthier, and public spending was easier to finance.
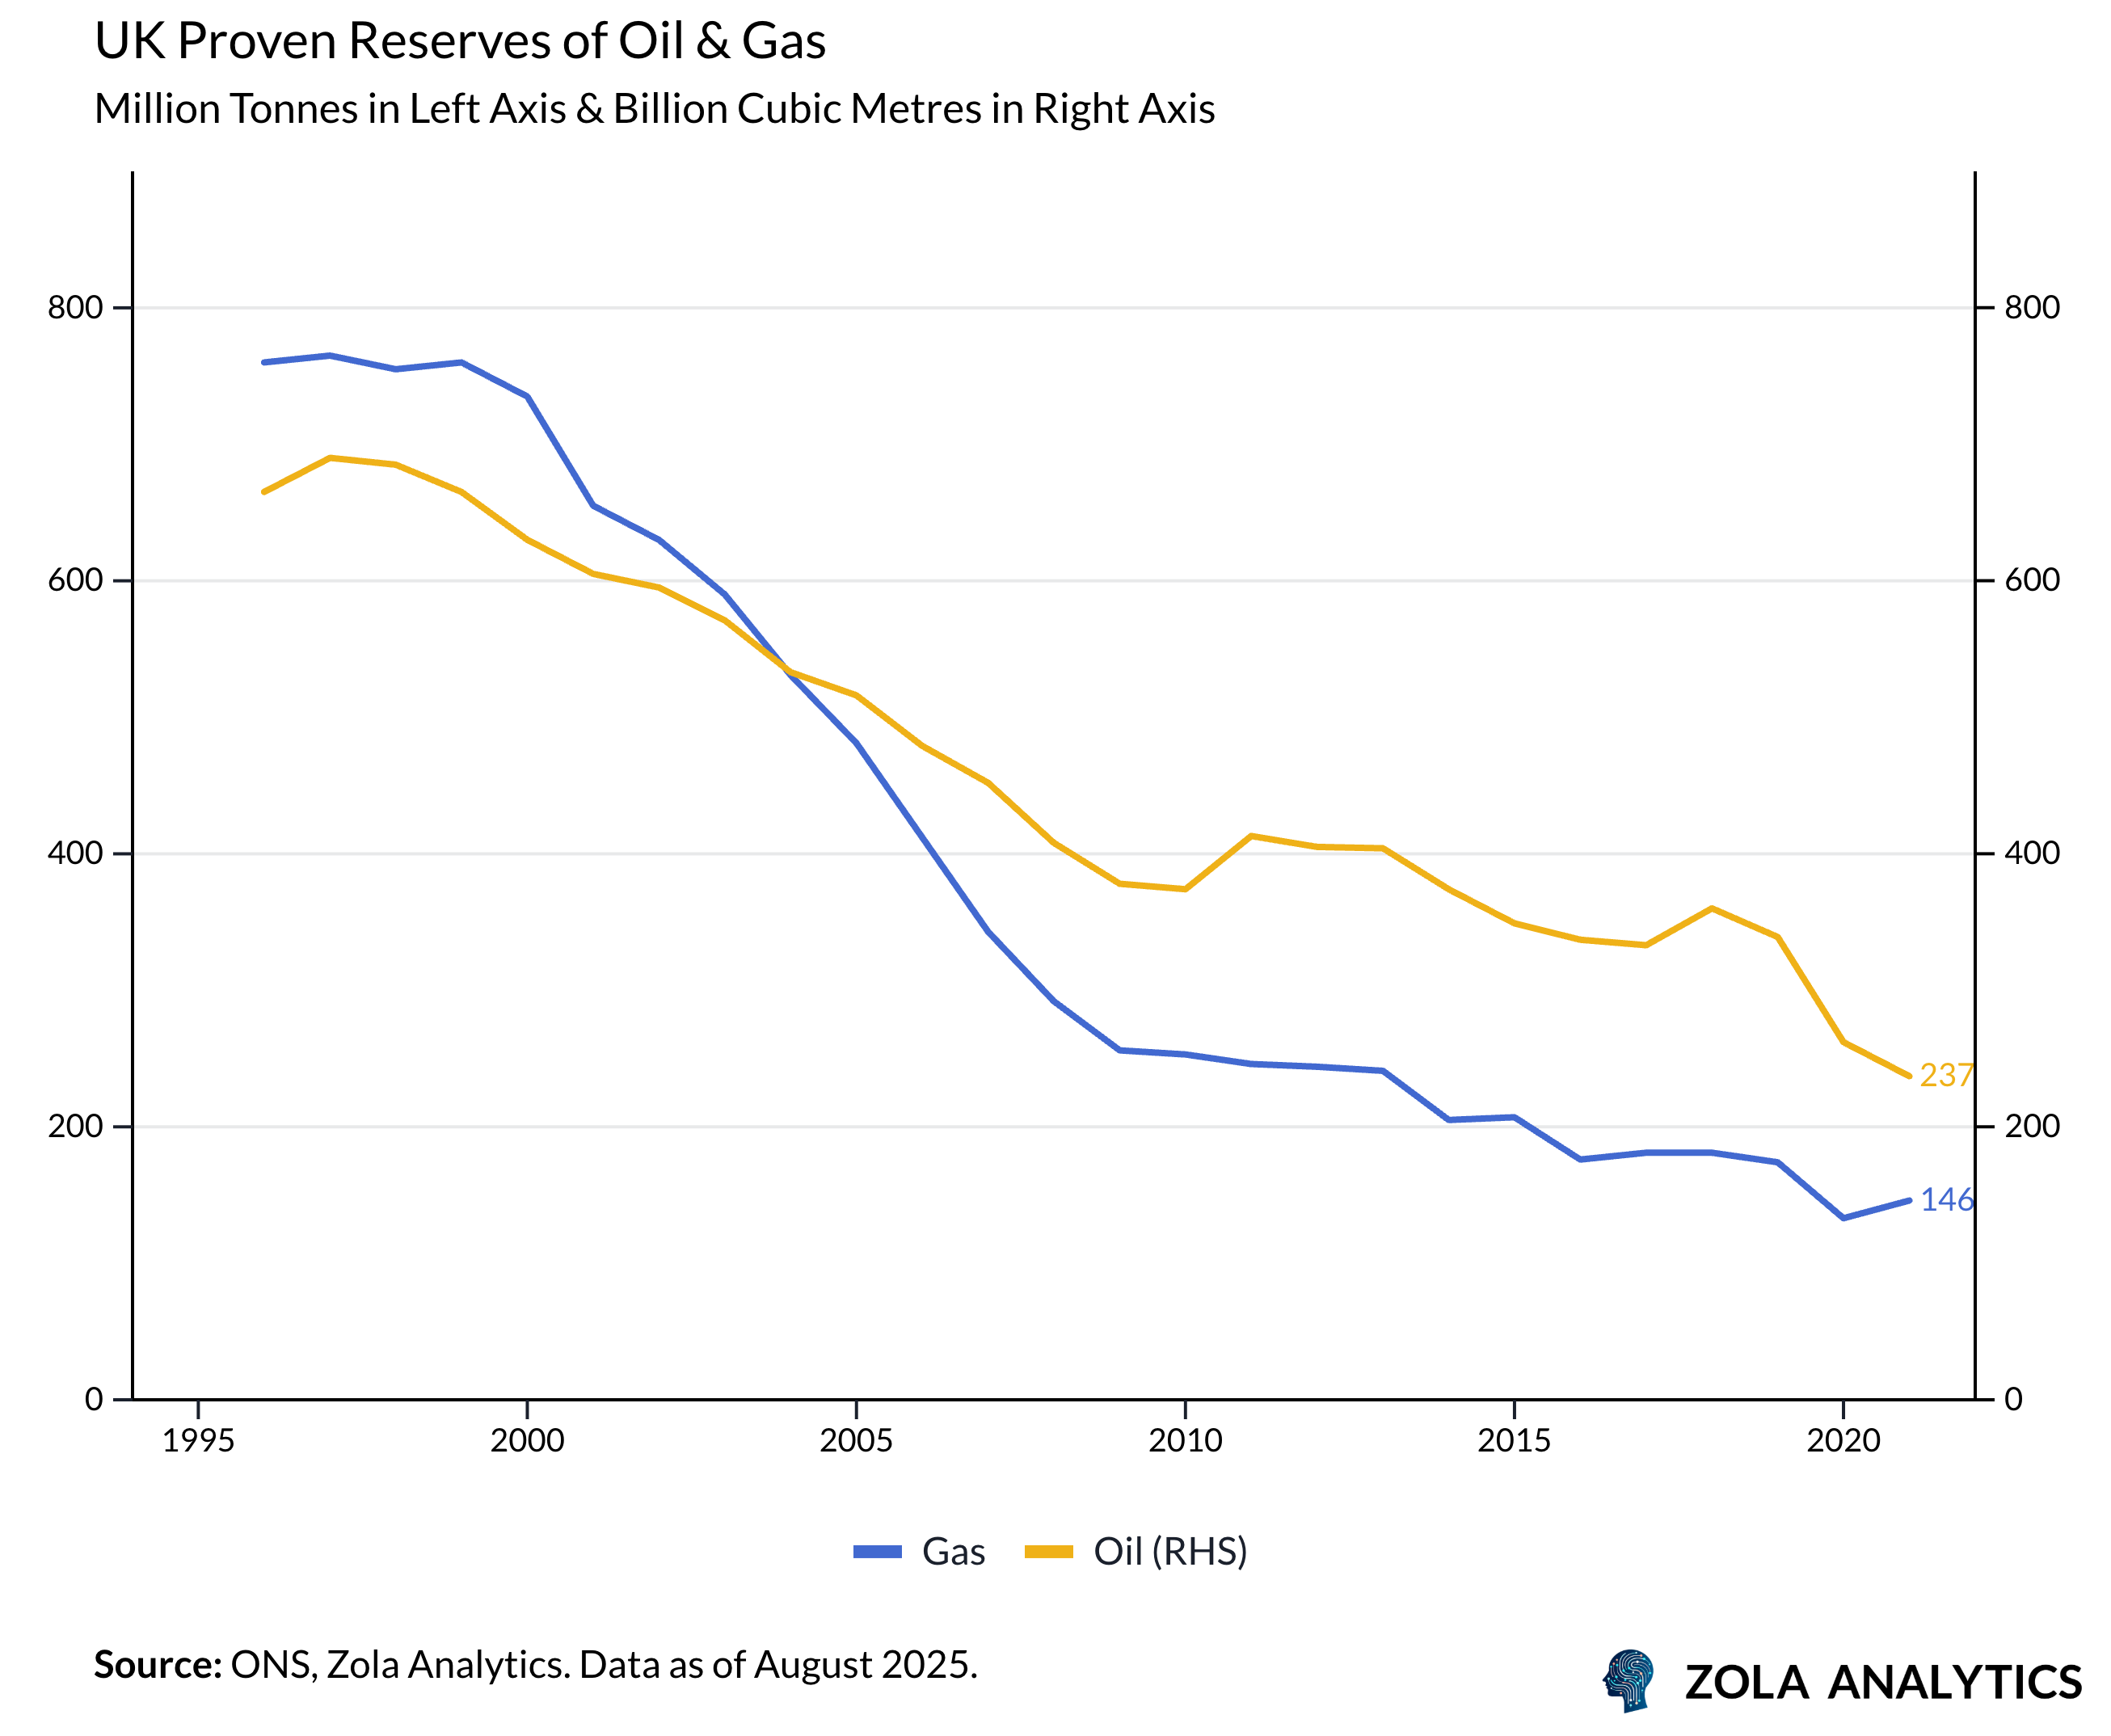
That cushion has thinned. Production declined from its peak, proven reserves dwindled, and volatility in global prices turned from boon to risk. What was once a fiscal and external-balance tailwind now leaves the UK more exposed to imported energy shocks.
A Demographic Dividend
The working-age share of population rose through the 1980s–2000s, female participation climbed, and migration supplemented labour supply. More workers per capita meant faster GDP per head even without spectacular productivity gain
That dividend has faded. Post-pandemic, inactivity rose—particularly due to long-term sickness—while early retirement and health backlogs reduced hours worked.
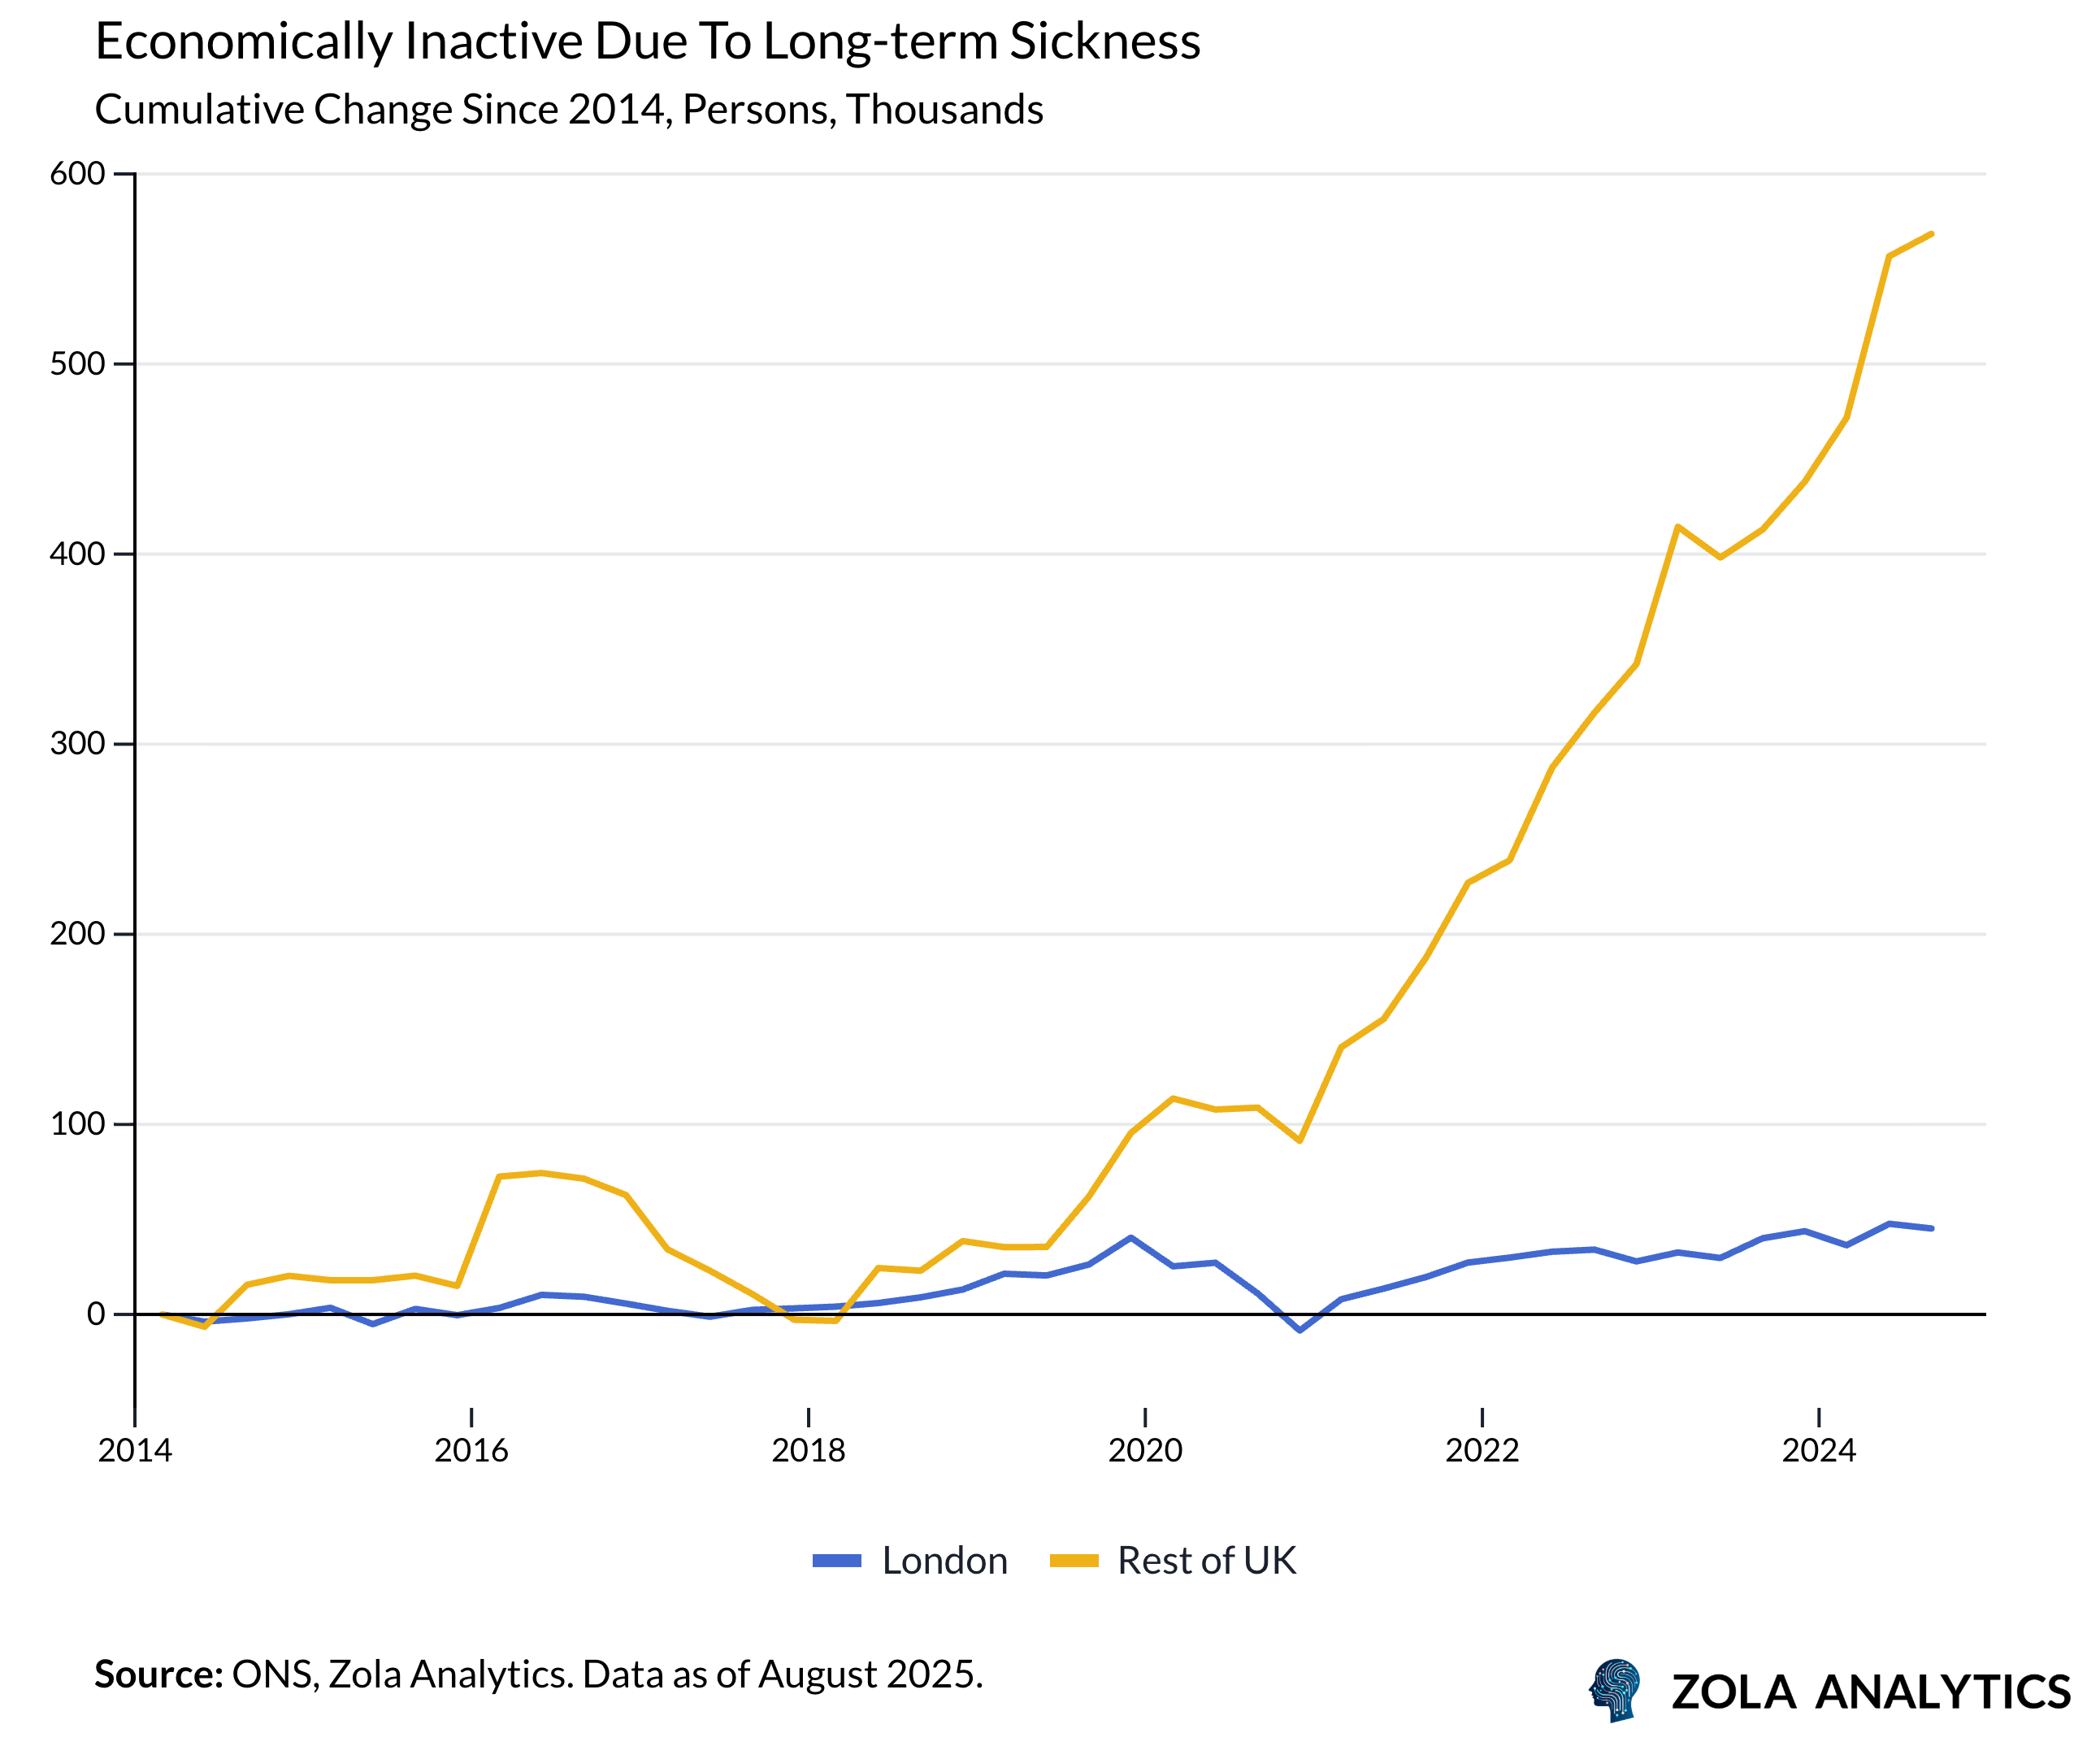
Participation of older workers has been sticky, skills mismatches widened, and migration policy volatility has complicated workforce planning. We now see fewer hours per person, with weaker labour-quality gains than in the 1990s and 2000s.
The IT Revolution
The software wave of the 1990s - plus retail and services reorganisations - drove growth in total factor productivity thanks to capital deepening (firms expanding the amount and quality of capital available to each worker). As processes digitised and tools improved, measured output per hour rose.
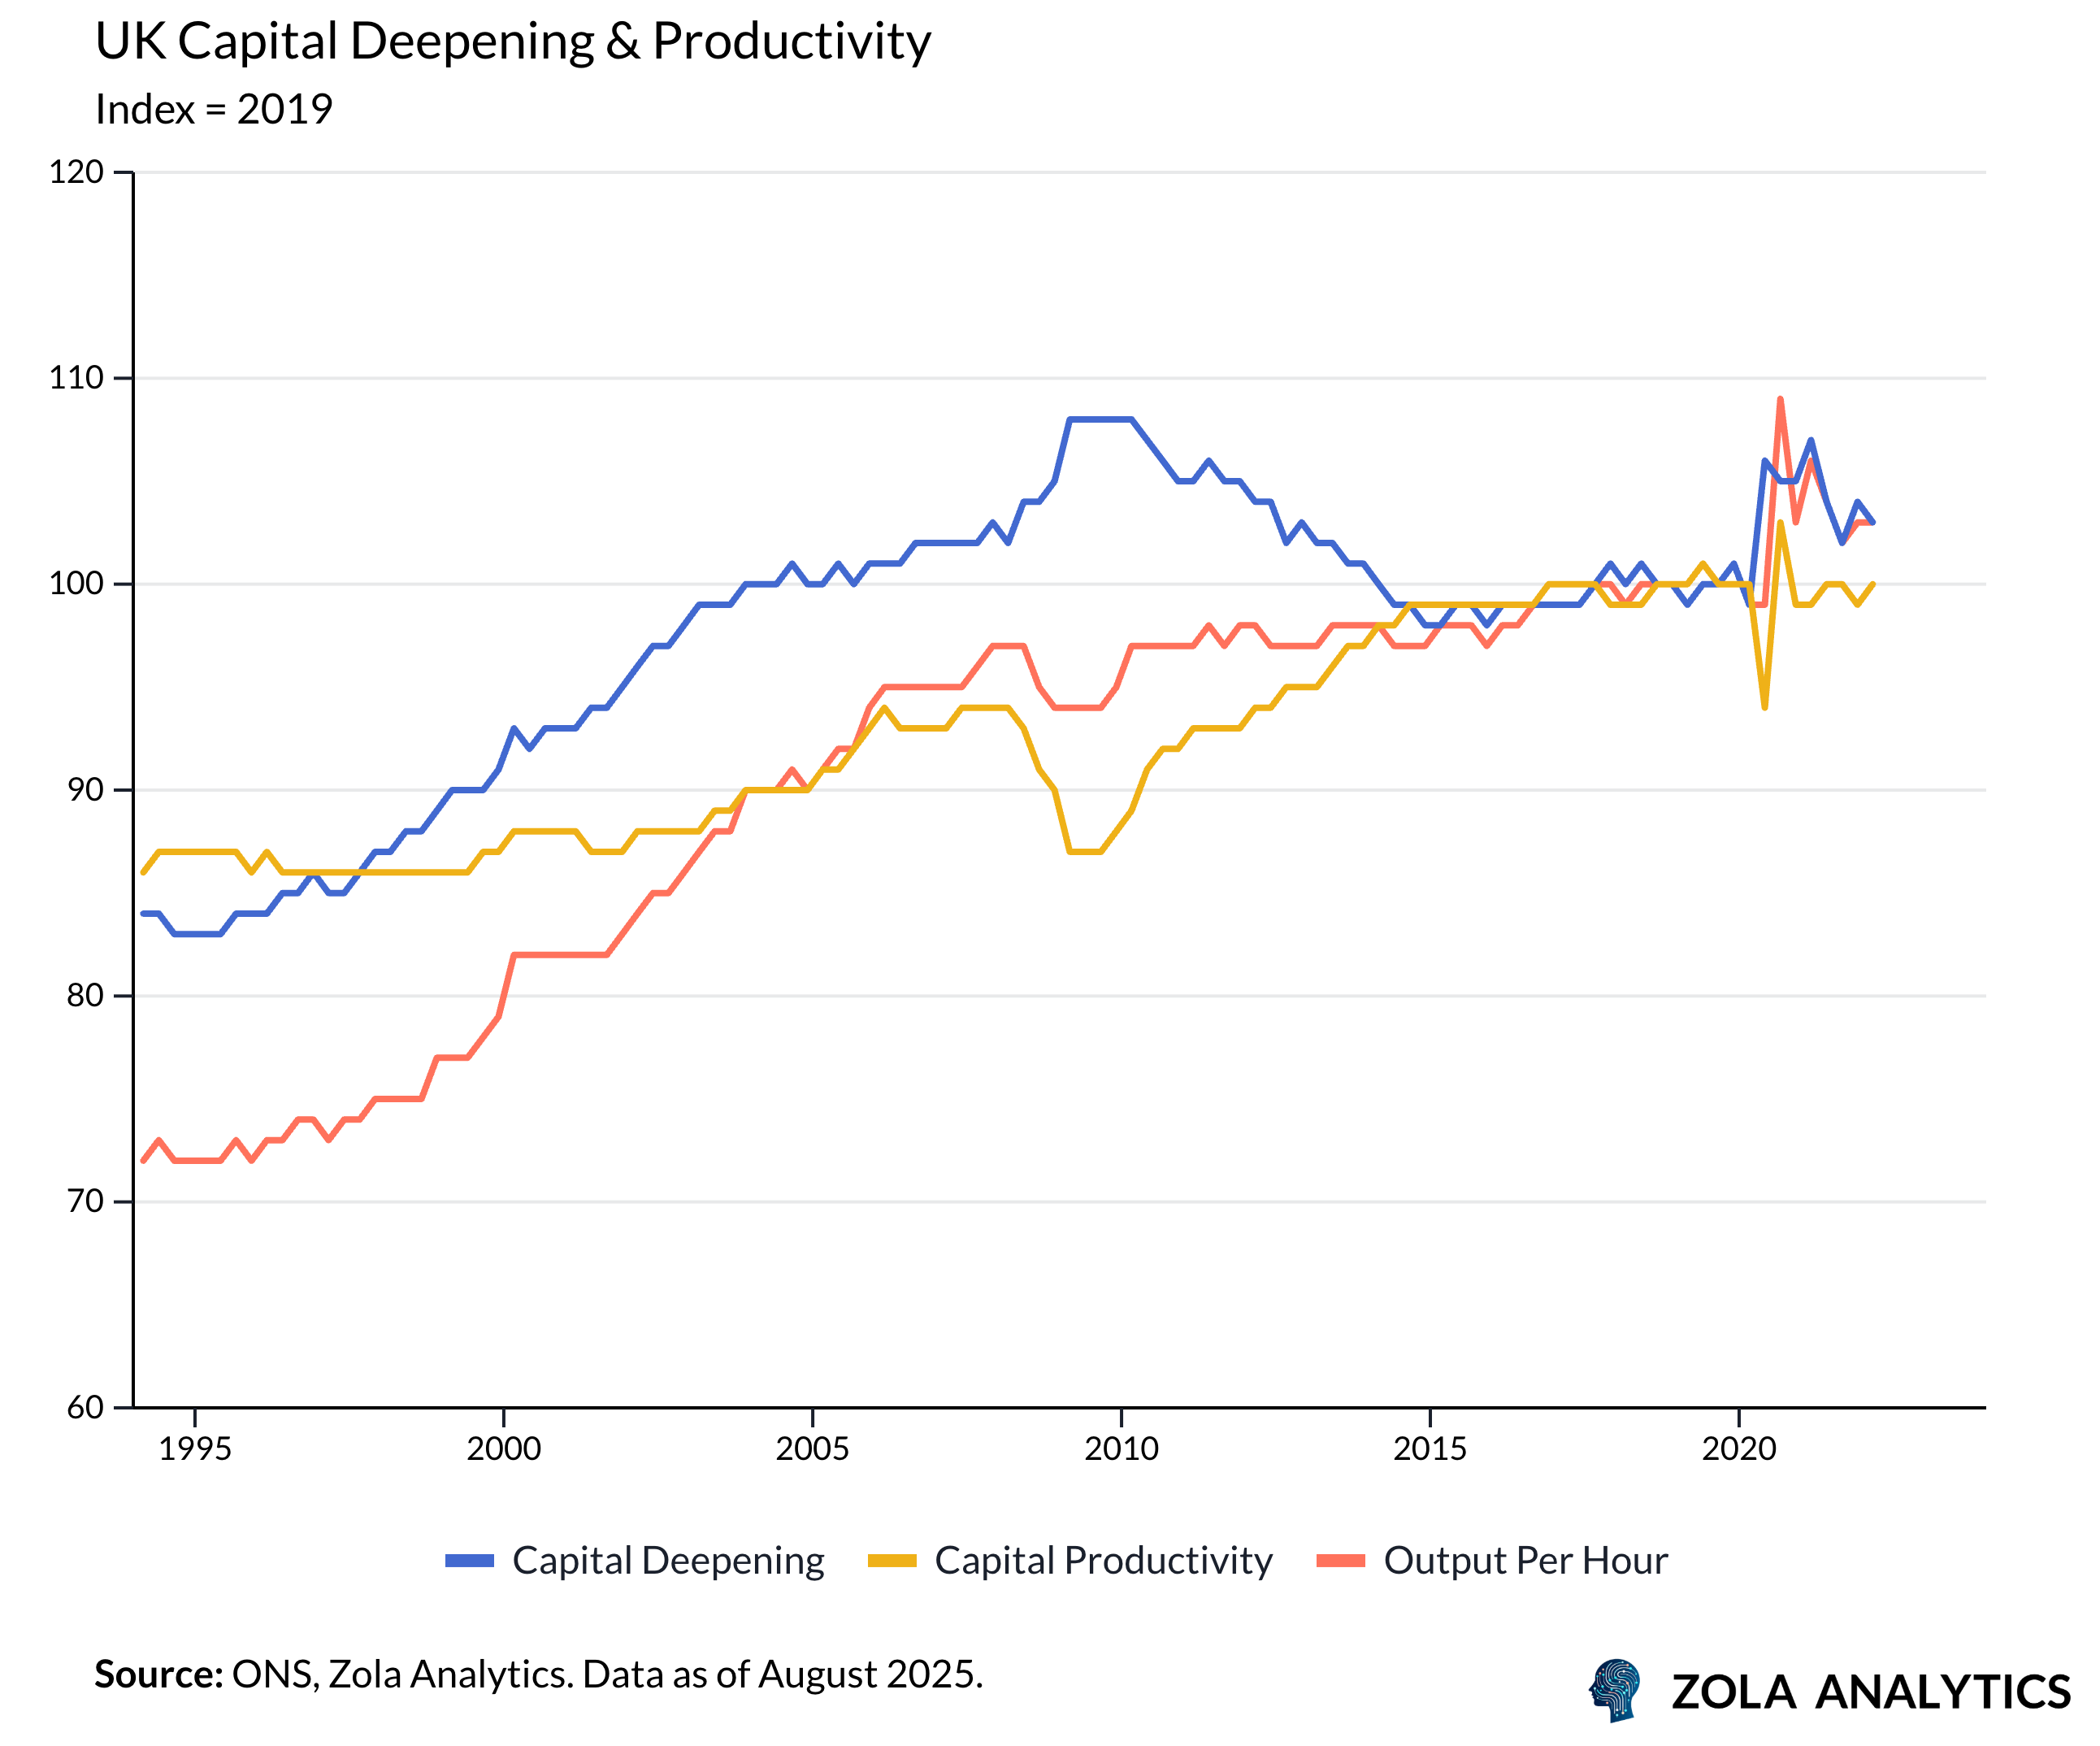
Since the global financial crisis, that well has run dry. Business investment collapsed in 2008–09, stalled through the mid-2010s amid policy and trade uncertainty, and took another hit during the pandemic. Even when the level recovered, it did so from a low base and remained weak by international standards.
An Investment Drought
What explains the UKs dismal levels of investment? Primarily, the country has lost the ability to execute on its plans.
Planning and permitting create veto points at every stage - housing, business premises, grid connections, energy - raising risk, time and cost.
Energy is expensive and unreliable. This makes the UK a shaky bet for long-term irreversible investments of the kind that support productivity growth.
Policy whiplash - on corporation tax, allowances, industrial strategy and trade rules - shortens horizons and pushes returns below hurdle rates.
Financing skews toward property and leveraged deals; patient, scale-up capital is thin; pensions and listings rules have nudged firms toward payouts over capex.
Skills and migration frictions leave firms facing shortages just where adoption would pay; training pipelines are patchy for technicians and engineers.
Trade frictions add non-tariff costs for exporters and supply chains. The long-run impact of Brexit has been to stifle capital formation.
Over decades, Britain has too often sold assets to fund consumption and celebrated high payout ratios while under-maintaining core infrastructure. Financialisation made it easy to farm mature utilities for dividends rather than reinvest—water being the most visible example. The fastest growing British businesses of the past 10 years are Bet365 and OnlyFans - these are hardly industries that will foster high rates of sustainable growth. The result has been an economy rich in cash flows in a few niches, thin in the physical and organisational capital that drives broad-based growth.
A Hail Mary?
But could there be a silver lining? It’s possible that AI could lead to a broad-based productivity boom in which Britain plays a leading role. The UK has natural strengths: a deep research base and world-class universities, dense professional and financial services networks, English-language spillovers, and a big market for software-intensive services.
However, high energy costs, barriers to investment, and an increasingly punitive tax regime for high-earners might stymie AI diffusion and adoption. A bigger risk is that AI may turn out to be more of a substitute than a complement to British strengths. Dan Wang described the UK as a specialist in the ‘sounding-clever industries—television, journalism, finance, and universities’. When intelligence is at everyone’s fingertips, Britain may find its comparative advantages are quickly eroded.
Sign up to receive the Zola Global Macro Chartbook every week: https://www.zolaanalytics.com/insights?signUp